
When we founded StreetLight Data back in 2011, our sole focus was to help educate and plan for electric vehicles (EVs). We quickly realized that our transportation data would have a more significant positive impact if we expanded our mission beyond EV data analytics. However, EVs are still one of my deep interests: I drove a Chevy Volt for several years before going car-free, and I focused on EVs in my early career at the Rocky Mountain Institute and Federal Energy Regulatory Commission.
Based on my personal experience, I know we can do a better job of planning and deploying EV charging infrastructure. If we want to see wide adoption of EVs and promote sustainable transportation networks, then we must make charging more convenient and affordable while minimizing its impact on our electrical grid.
Given the wave of new charging station deployments in the U.S. and abroad — and the funding now available for EV charging infrastructure through Bipartisan Infrastructure Law (BIL) programs like the National Electric Vehicle Infrastructure (NEVI) and Charging and Fueling Infrastructure (CFI) grants — now seems like the right time to explain how Big Data can help.
As transportation infrastructure planners, it’s important to recognize that most charging will be done at home. But convenient, cost-effective out-of-home charging is necessary to get the adoption levels we want from EVs. EV charging analytics derived from Big Data can support better out-of-home electric vehicle charging in four ways:
- Site Selection – Macro: Scan an entire city to find the best places for EV charging.
- Site Selection – Micro: Analyze and validate individual potential sites.
- Education and Awareness: Select highly visible “activity centers” for chargers to maximize public exposure.
- Right Sizing: Improve estimation of grid load and electrical cost (and ancillary grid service applications).
In this blog post, I will discuss each of these topics using EV charging analyses created in StreetLight InSight®. (That’s our online platform for transforming location records created by connected devices into travel pattern analytics.)
Site Selection – Macro: Scan an Entire City to Find the Best Places for EV Charging
Although most EV charging will be done at home, the well-documented phenomenon of “range anxiety” is slowing adoption. Using transportation analytics, we can scan an entire city or region to find the best places for EV chargers. On-demand EV data analytics allow us to define “best” in different ways, and easily run multiple scans at very low marginal cost and effort.
Here’s a quick video on how this works in the StreetLight InSight® platform:
For example, let’s say that I believe the best charging station locations will be the workplaces of people who:
- Drive more than 40 miles a day (so they might want to recharge mid-day),
- Live in neighborhoods that currently have high hybrid adoption, and
- Go to the same workplace almost every weekday.
I can scan every block or property in a region to highlight where such early adopters tend to park. In Figure 1 below, you can see this scan on a 1-kilometer grid in the San Francisco Bay Area. However, I could also use StreetLight InSight® to scan for other key characteristics, for example:
- Where people from a particular income bracket go when they’re not working or at home,
- Where cars tend to be on longer drives when they still have 100 miles to go,
- Where people who don’t have driveways tend to park.
There are many possibilities, and EV planners can explore the ideal charging locations for the different types of EV adoption they want to foster.
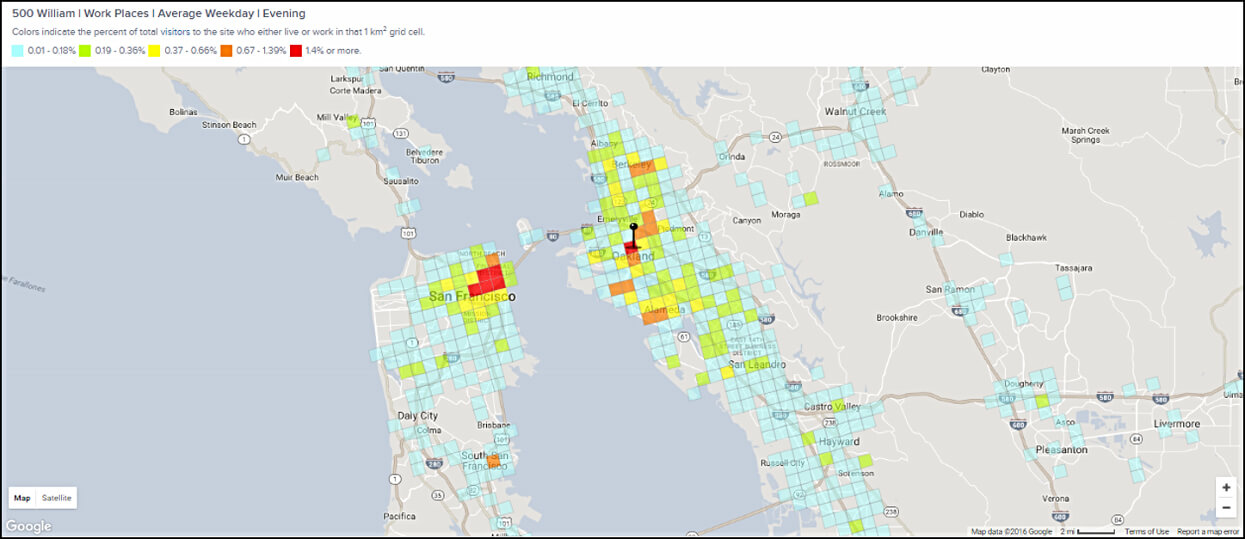
Figure 1: A scan of the San Francisco Bay Area that highlights the work neighborhoods of people who drive more than 40 miles per day and currently live in high-hybrid adoption areas.
Note that you can actually do this type of macro-analysis for all kinds of new transportation technologies.
Site Selection – Micro: Analyze and Validate Individual Potential Sites
Sometimes, the question of EV charger location optimization is more constrained. Perhaps a retail brand has 200 locations, and wants to deploy EV chargers to 20 of them. Which 20 locations are the best? Using similar logic as described above, individual locations can be scored for certain characteristics of drivers at or near the location (see Figure 2 below).
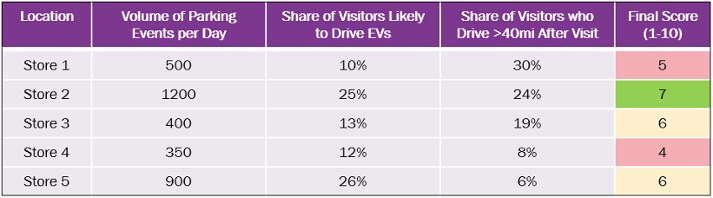
Figure 2: A chart showing EV “scores” based on three criteria for a group of stores from the same brand.
This micro-site selection analysis can also be used to select amongst individual properties and locations within a single neighborhood that a macro-scan previously identified as a strong candidate (see Figure 3 below).
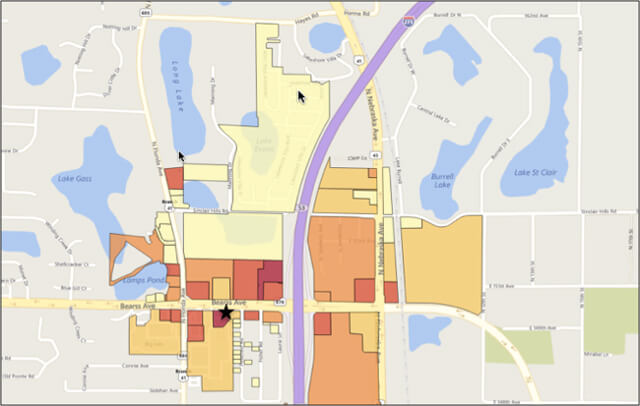
Figure 3: The highest scoring EV parcels within 500 meters of an off-ramp in Texas that a macro-scan previously identified as “high EV convenient.” Parcels shaded in red have the best scores for EV convenience.
Education and Awareness
Simply being seen is one of the more important features of EV chargers. Chargers remind citizens of the availability of EVs, and they build confidence that charging will be easy and convenient. Analyzing for visibility can be a simple numbers game. We want to find out:
- Which roadside areas are seen by the most people driving by?
- Which parking lots are parked in most often?
Transportation analytics can help answer both of these questions. In Figure 4, Retail Group C’s parking lot has more parking events than A or B. From a visibility perspective, it may be the best bet, though not necessarily from a charging load perspective.
Right Sizing and Better Estimation of Grid Load
The distribution of the time of day during which charging occurs can make a big difference in terms of the number of chargers needed (and thus the installation cost), the load on the grid, and the costs associated with charging. Depending on the locality, EV charging rates can vary by time of day. For businesses and commercial properties that face costs based on demand, charging can also trigger extra fees from their utility company.
Thus, knowing the time of day when EVs are likely to be charging is critical for estimating installation and operating costs. In addition, time of day information is necessary for anyone exploring more integrated vehicle-to-grid ideas. Figure 4 shows a parking load curve for three similarly-sized commercial parking lots in Texas that are located within one-half mile of each other along the same road. These are their key characteristics:
- Lot A contains a movie theater and restaurants,
- Lot B contains one very large big box retailer, and
- Lot C contains a group of four big box retailers.
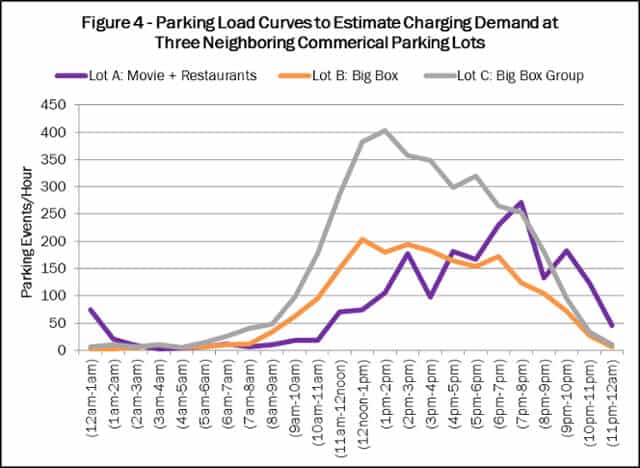
Figure 4: This graph shows the parking load for three different commercial lots in Texas during a 24-hour period.
While Lot C has the most visitors per day, they peak during the midday and afternoon time periods. In many localities, especially those with hot climates, utility companies charge the highest rates during midday and afternoon. While Lot A has fewer total people, it peaks in the evening. At the same time, such a peaky load may mean that a lot of people want to charge at once, making it necessary to install a few more stations.
Depending on local rate structure and demand charging schemes, the cost of installing chargers at these three parking lots can vary widely, even though they are located close to one another and have similar profiles. Using “generic” load curves won’t reveal this variation – only working with comprehensive and flexible EV charging analytics can.
See how New England’s largest utility used EV charging analytics like these to identify charging peaks, measure grid load, anticipate where substation upgrades would be needed, and prepare electric grid infrastructure for growing EV charging demand.
For more information on StreetLight’s electric vehicle data analytics for charger site selection, emissions measurement, and more, check out our EV charging data solutions.