In this post, we explore using Big Data for detour planning using StreetLight InSight®, our easy-to-use web application for transforming Big Data from mobile devices into transportation Metrics. We analyzed the Race Street Bridge in Lehigh Valley, Pennsylvania because that region’s planning commission intends to spend nearly $183 million USD upgrading 30+ bridges in the next four years – including this one. Because of the FAST Act, communities like Lehigh Valley can now more easily tap federal funds for much-needed repairs.
While making improvements to core infrastructure like bridges is critical, construction can disrupt travel patterns, creating bottlenecks and unintended safety issues. That’s where data-driven detour planning can make a difference by:
- Estimating the impact a closure could have on other bridges;
- Targeting interventions to mitigate negative impacts.
With the right real-world data, communities can deploy targeted transportation demand management incentives in key areas and optimize detour design. Expenditures that are based on actual, measured behaviors are more likely to deliver good ROI in terms of both congestion avoided and dollars spent.
Travel Patterns on the Race Street Bridge
We began our high-level detour planning analysis with three key questions:
- Where do Race Street Bridge users begin and end their trips?
- What bridges would Race Street users most likely prefer as alternatives?
- Can other bridges accommodate traffic if the Race Street Bridge is closed?
To answer these questions, we created an Origin-Destination with Middle Filter Project using StreetLight InSight, which is similar to a Select Link Analysis. For our origins and destinations, we identified 12 “Zones of Influence” in the region (See Figure 1). For our links, or “Middle Filters” in our terminology, we used 12 bridges: the Race Street Bridge and nearby bridges that could serve as alternate routes (See Figure 2).
The six external Zones are “pass through” Zones, which means that they capture external trips – those that do not begin and/or end in that Zone – but that use one of the bridges we identified. We used the Race Street Bridge and the bridges that could serve as alternates if Race Street is closed as the markers for dividing the region into these “Zones of Influence.”

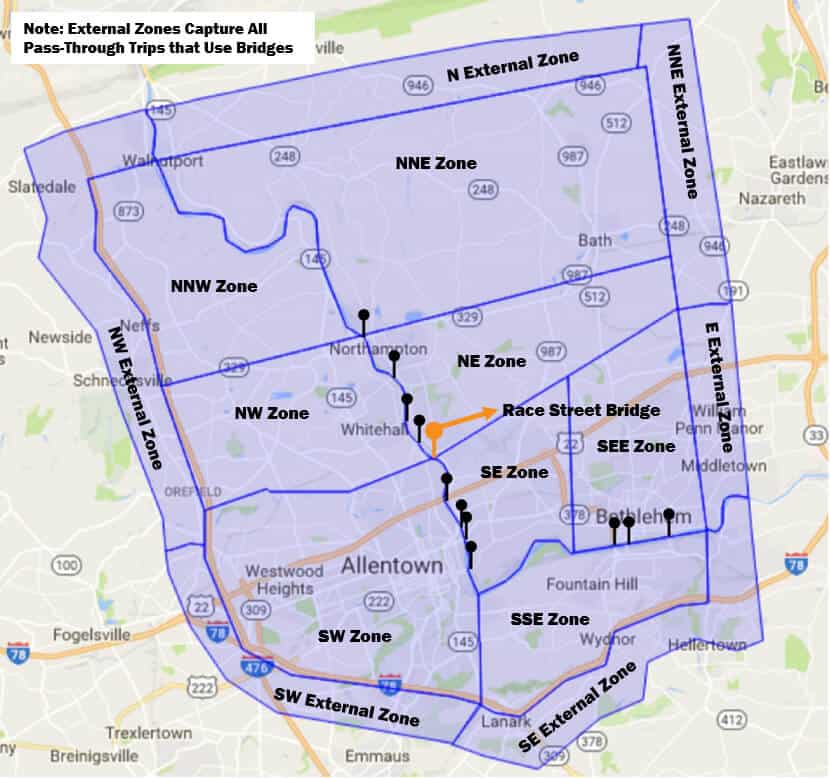
Figure 1: This map shows the study area divided into analysis Zones. Bridges are indicated with pins. External trips (those that do not originate and/or do not have destinations in the internal zones) that use the bridges in our study area are captured by the external zones.
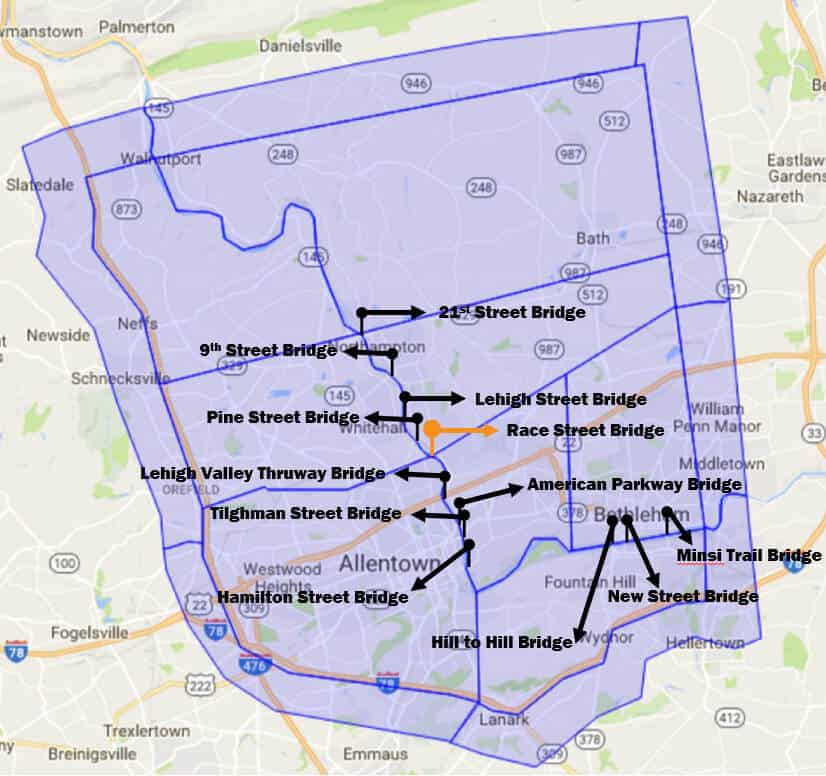
Figure 2: This map labels all of the bridges that served as our links, or “Middle Filters.”
This Origin-Destination with Middle Filter analysis was completed in about 45 minutes in StreetLight InSight, and was based on 12 months of data. The analysis generated Metrics that describe the relative volume of trips between each of the 24 pairs of Origin and Destination Zones that use the 12 bridges at different times of day and days of the week.
As visualized below in Figures 3 and 4, our analysis indicates that the greatest volume of trips using the Race Street Bridge traveled between these OD pairs:
- From the Southwest Zone to the Northeast Zone;
- From the Northeast Zone to the Southwest Zone.
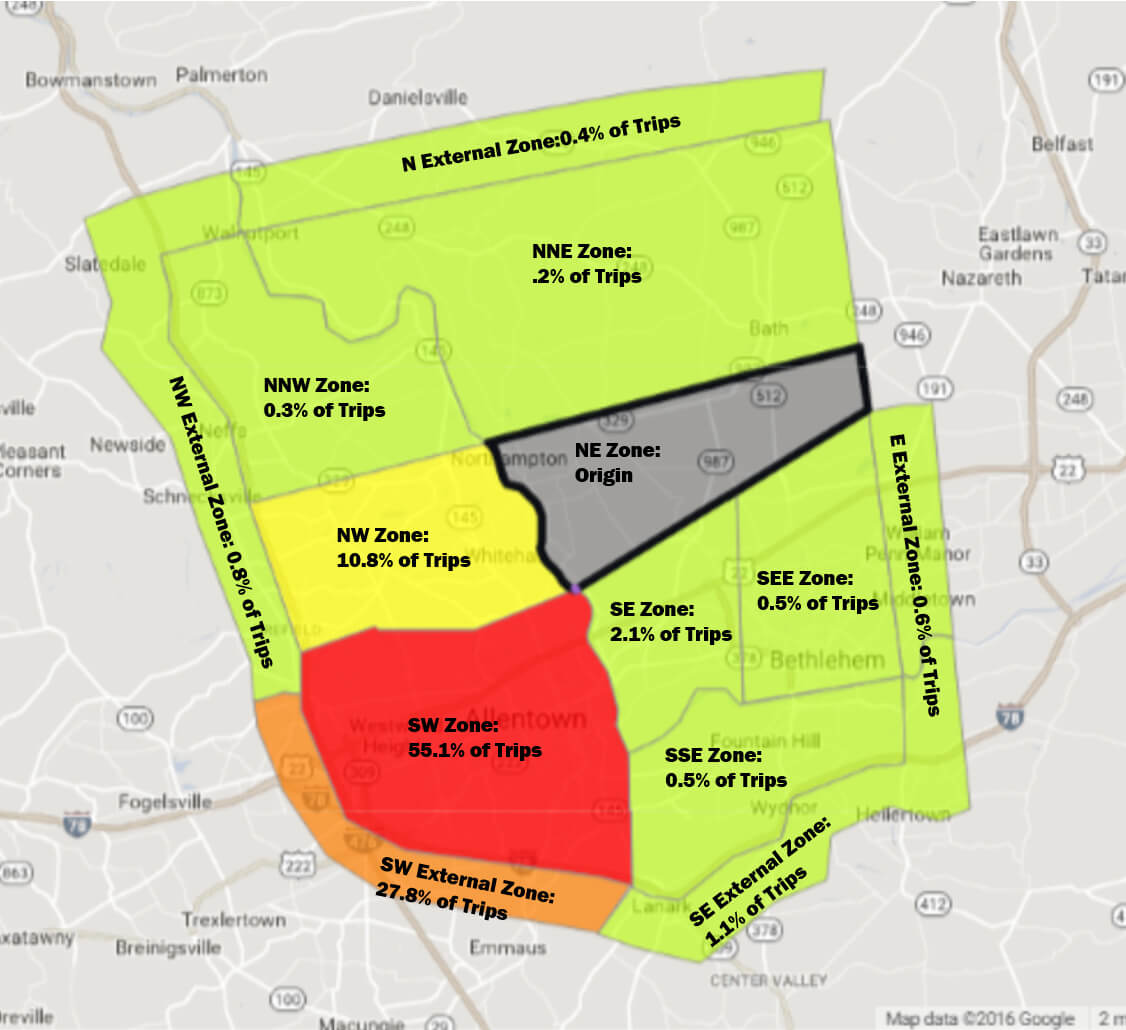
Figure 3: This heat map indicates the relative of volume of trips with origins in the NE Zone that used the Race Street Bridge. The external Zones capture all trips that pass through to other destinations.
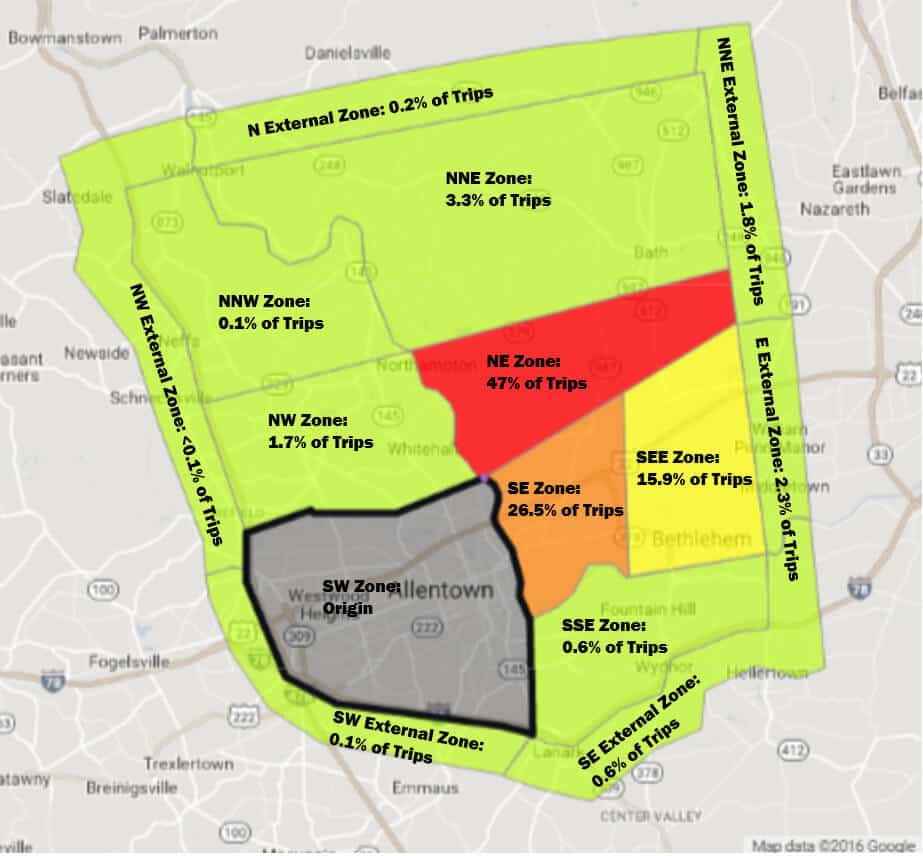
Figure 4: This heat map indicates that relative of volume of trips with origins in the SW Zone that used the Race Street Bridge. The external Zones capture all trips that pass through to other destinations.
Identifying the top OD pairs that use the Race Street Bridge can guide planners to concentrate on these two areas for:
- Construction and detour communications;
- Congestion mitigation programs, such as peak shifting and transit and work-from-home incentives.
Understanding Flows on Every Bridge
Our next step is to evaluate the flow of traffic across all the bridges in the area, and to determine bridge usage for the top two OD combinations for the Race Street Bridge. This will help us understand which bridges can most feasibly accommodate the trips that would typically use the Race Street Bridge.
To do this, we downloaded a .csv file of the StreetLight InSight Metrics visualized in the heat maps above. Using StreetLight InSight Metrics for relative trip volume, we determined the percentage of personal traffic that flows over each bridge daily and the share of traffic using each bridge that travels between the Race Street Bridge’s top OD pairs (See Figure 5).
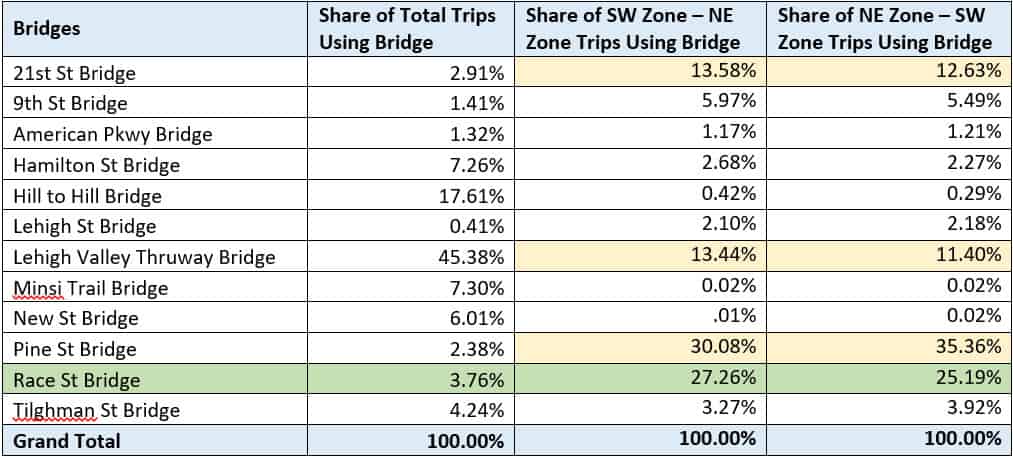
Figure 5: This chart shows the share of all personal trips taken across each bridge and compares it to the share of traffic between the most popular OD pairs for the Race Street Bridge. As shown above, the Race Street Bridge carries only 3.76% total bridge traffic on average, but it carries over ¼ of the trips between the SW-NE and NE-SW OD pairs. As one might expect, the values are symmetrical.