SAN FRANCISCO, CA – October 17, 2019 – StreetLight Data, Inc, the leader in Big Data analytics for mobility, today announced its Bike and Pedestrian Essentials. This new tier of the company’s StreetLight InSight® software offers a comprehensive set of active transportation metrics, delivered in response to the needs of transportation planners and new mobility companies for empirical data to enable improved bike, scooter and pedestrian infrastructure.
Since 2011, StreetLight Data has been pioneering on-demand vehicular traffic metrics for city planners, who have long struggled with obtaining timely and accurate data at scale. Measuring bicycle and pedestrian traffic has become an overwhelming challenge for communities who can’t afford to install and maintain a sufficient number of expensive counters to help measure — and manage — how multiple modes interact.
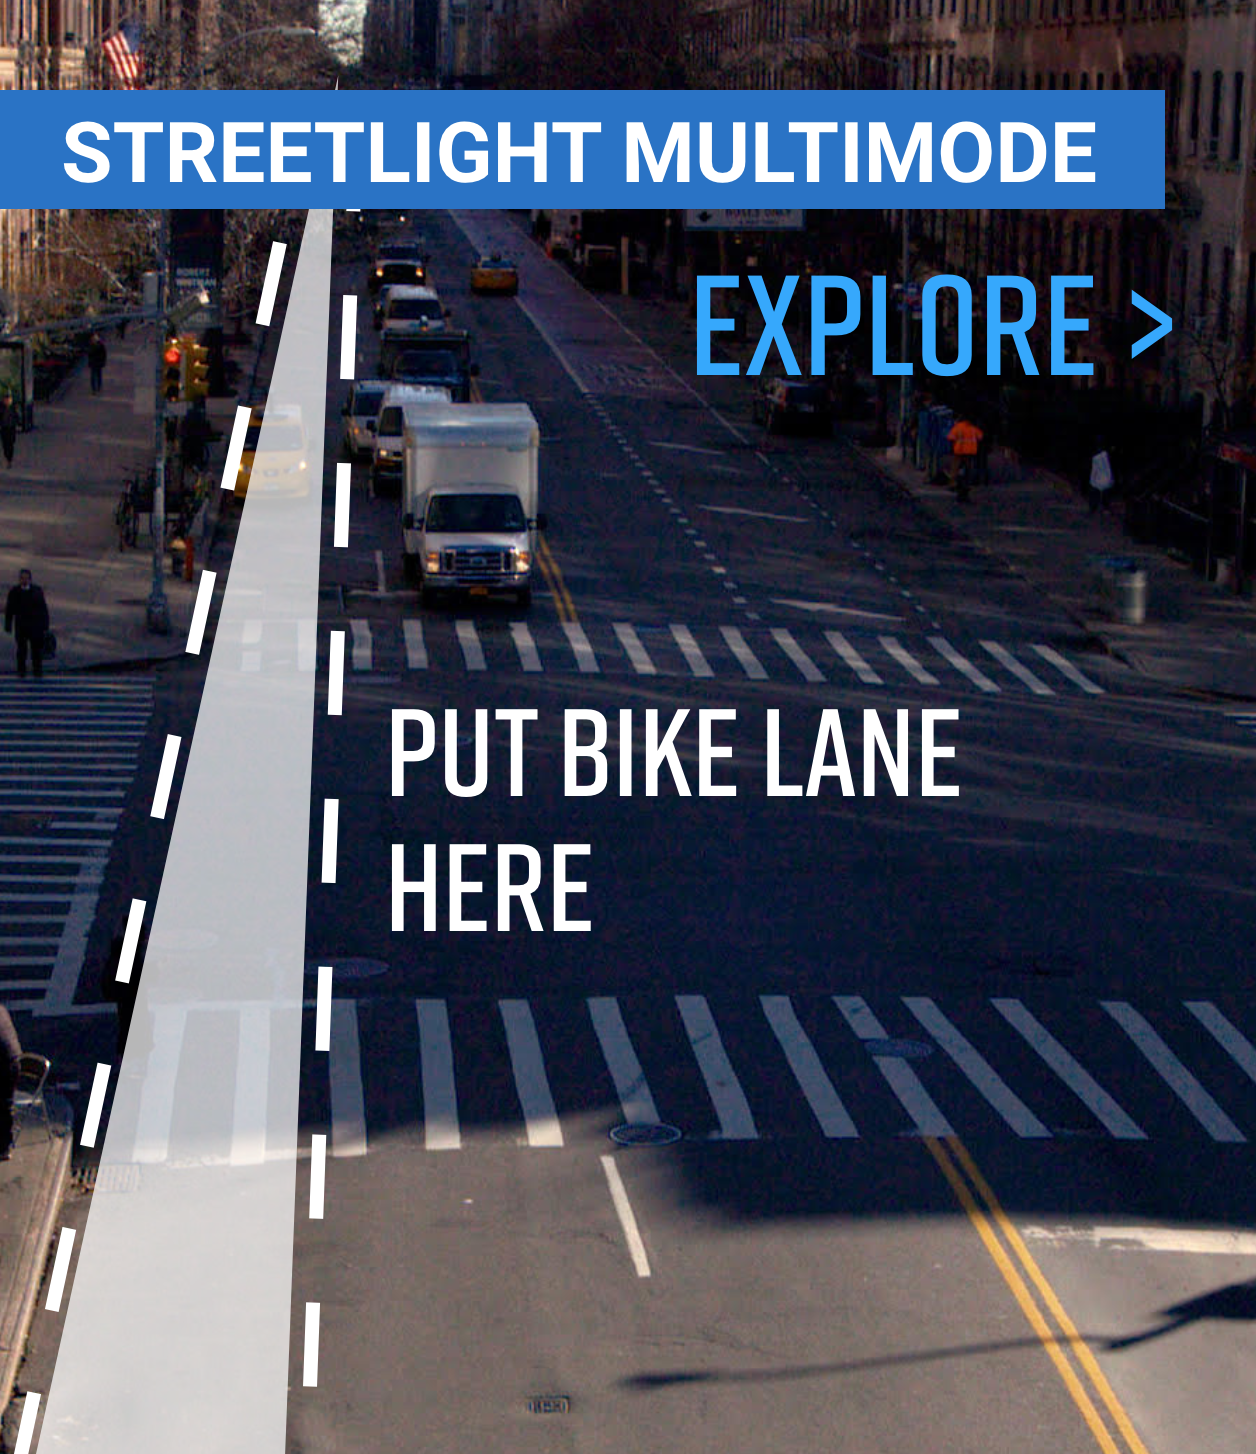
The new Bike and Pedestrian Essentials offers complete, stand-alone access to key industry metrics for these modes, previously offered only as part of StreetLight’s premium Multimode software tier. Available for select zones or an entire region, the new tier provides communities tools for a more nuanced understanding of active transportation usage, safety, and data-derived priorities for bike lanes and other infrastructure.
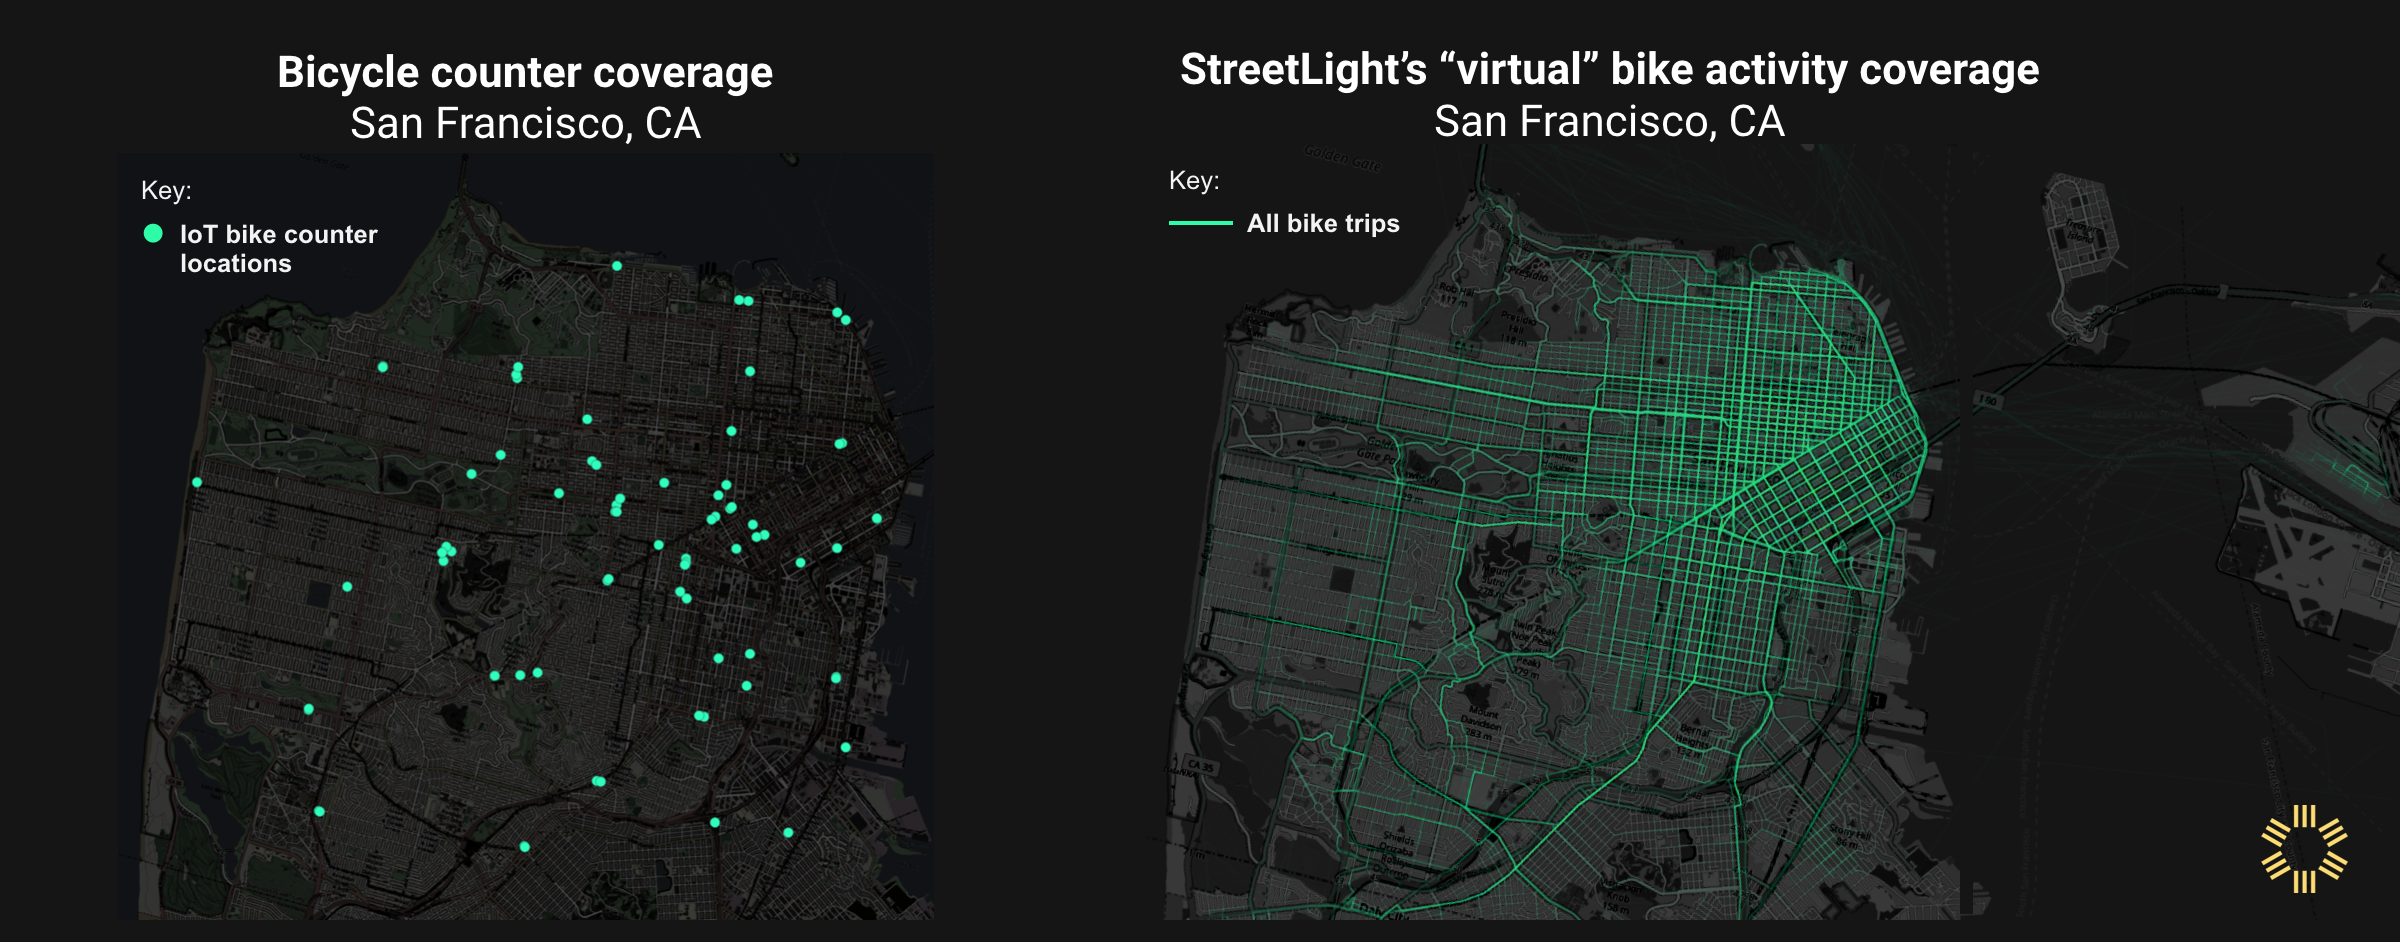
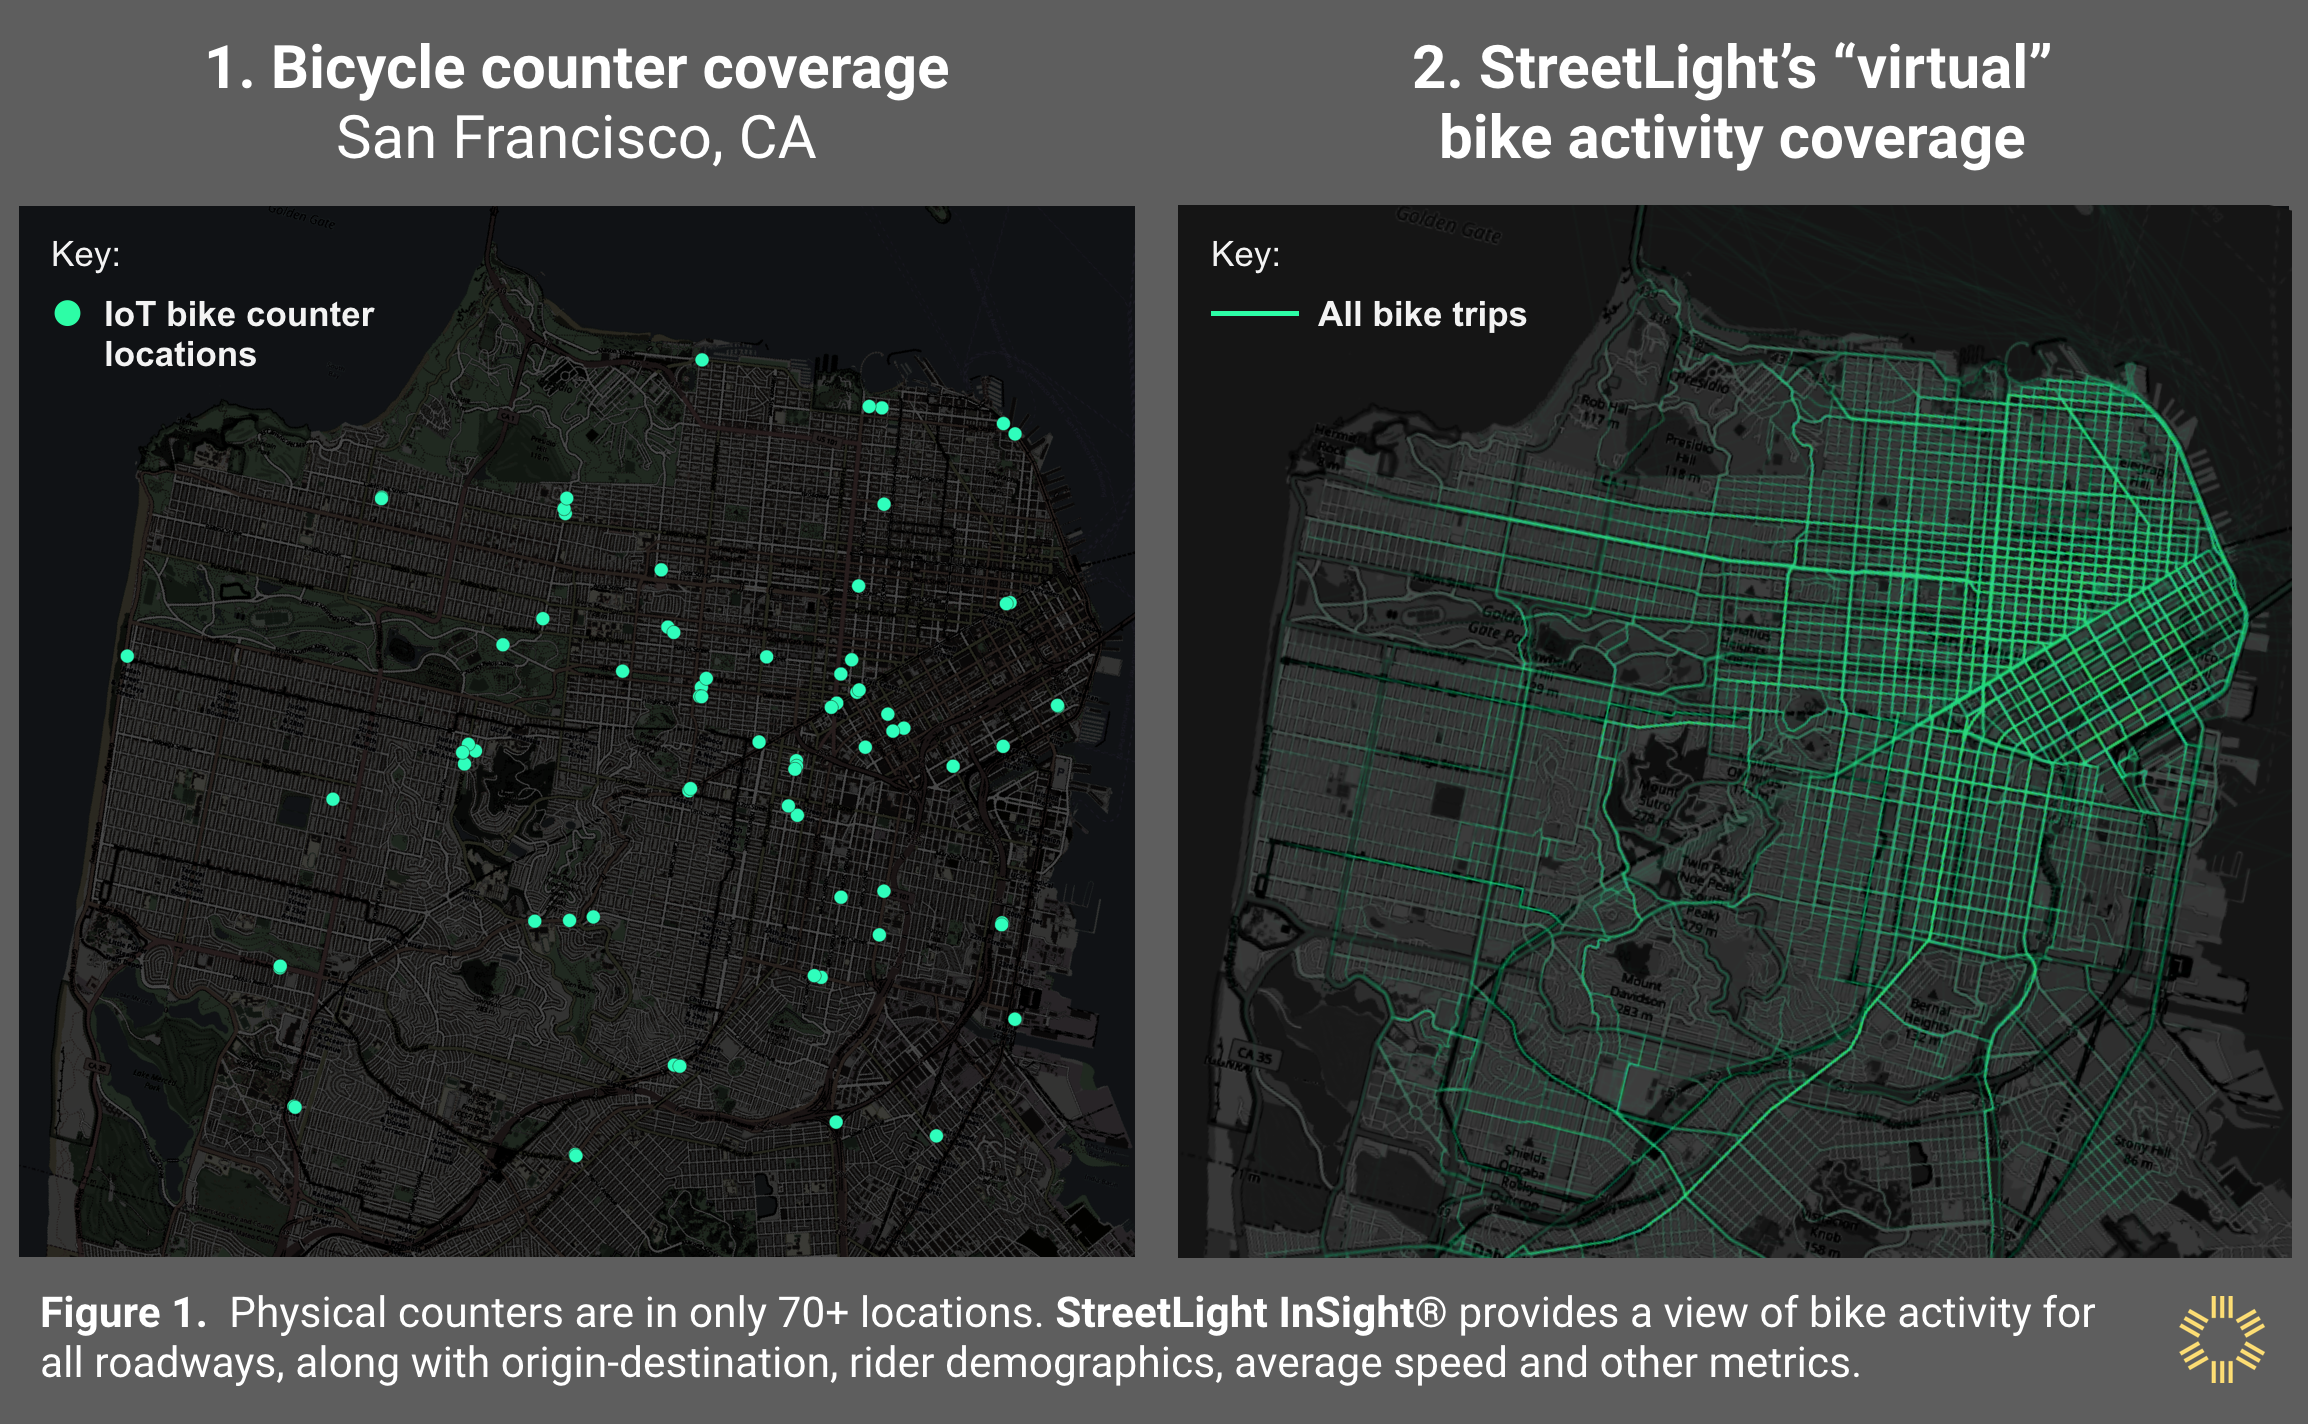
“Based in San Francisco, one of America’s most active cities, StreetLight’s move to pioneer active transportation metrics was a no-brainer,” said Sean Co, Director of Special Projects at StreetLight Data. “For a city with 1,200 miles of roadway, having 75 bicycle sensors offers only a partial perspective on bike traffic. StreetLight’s ‘virtual’ sensors cover nearly every city block.”
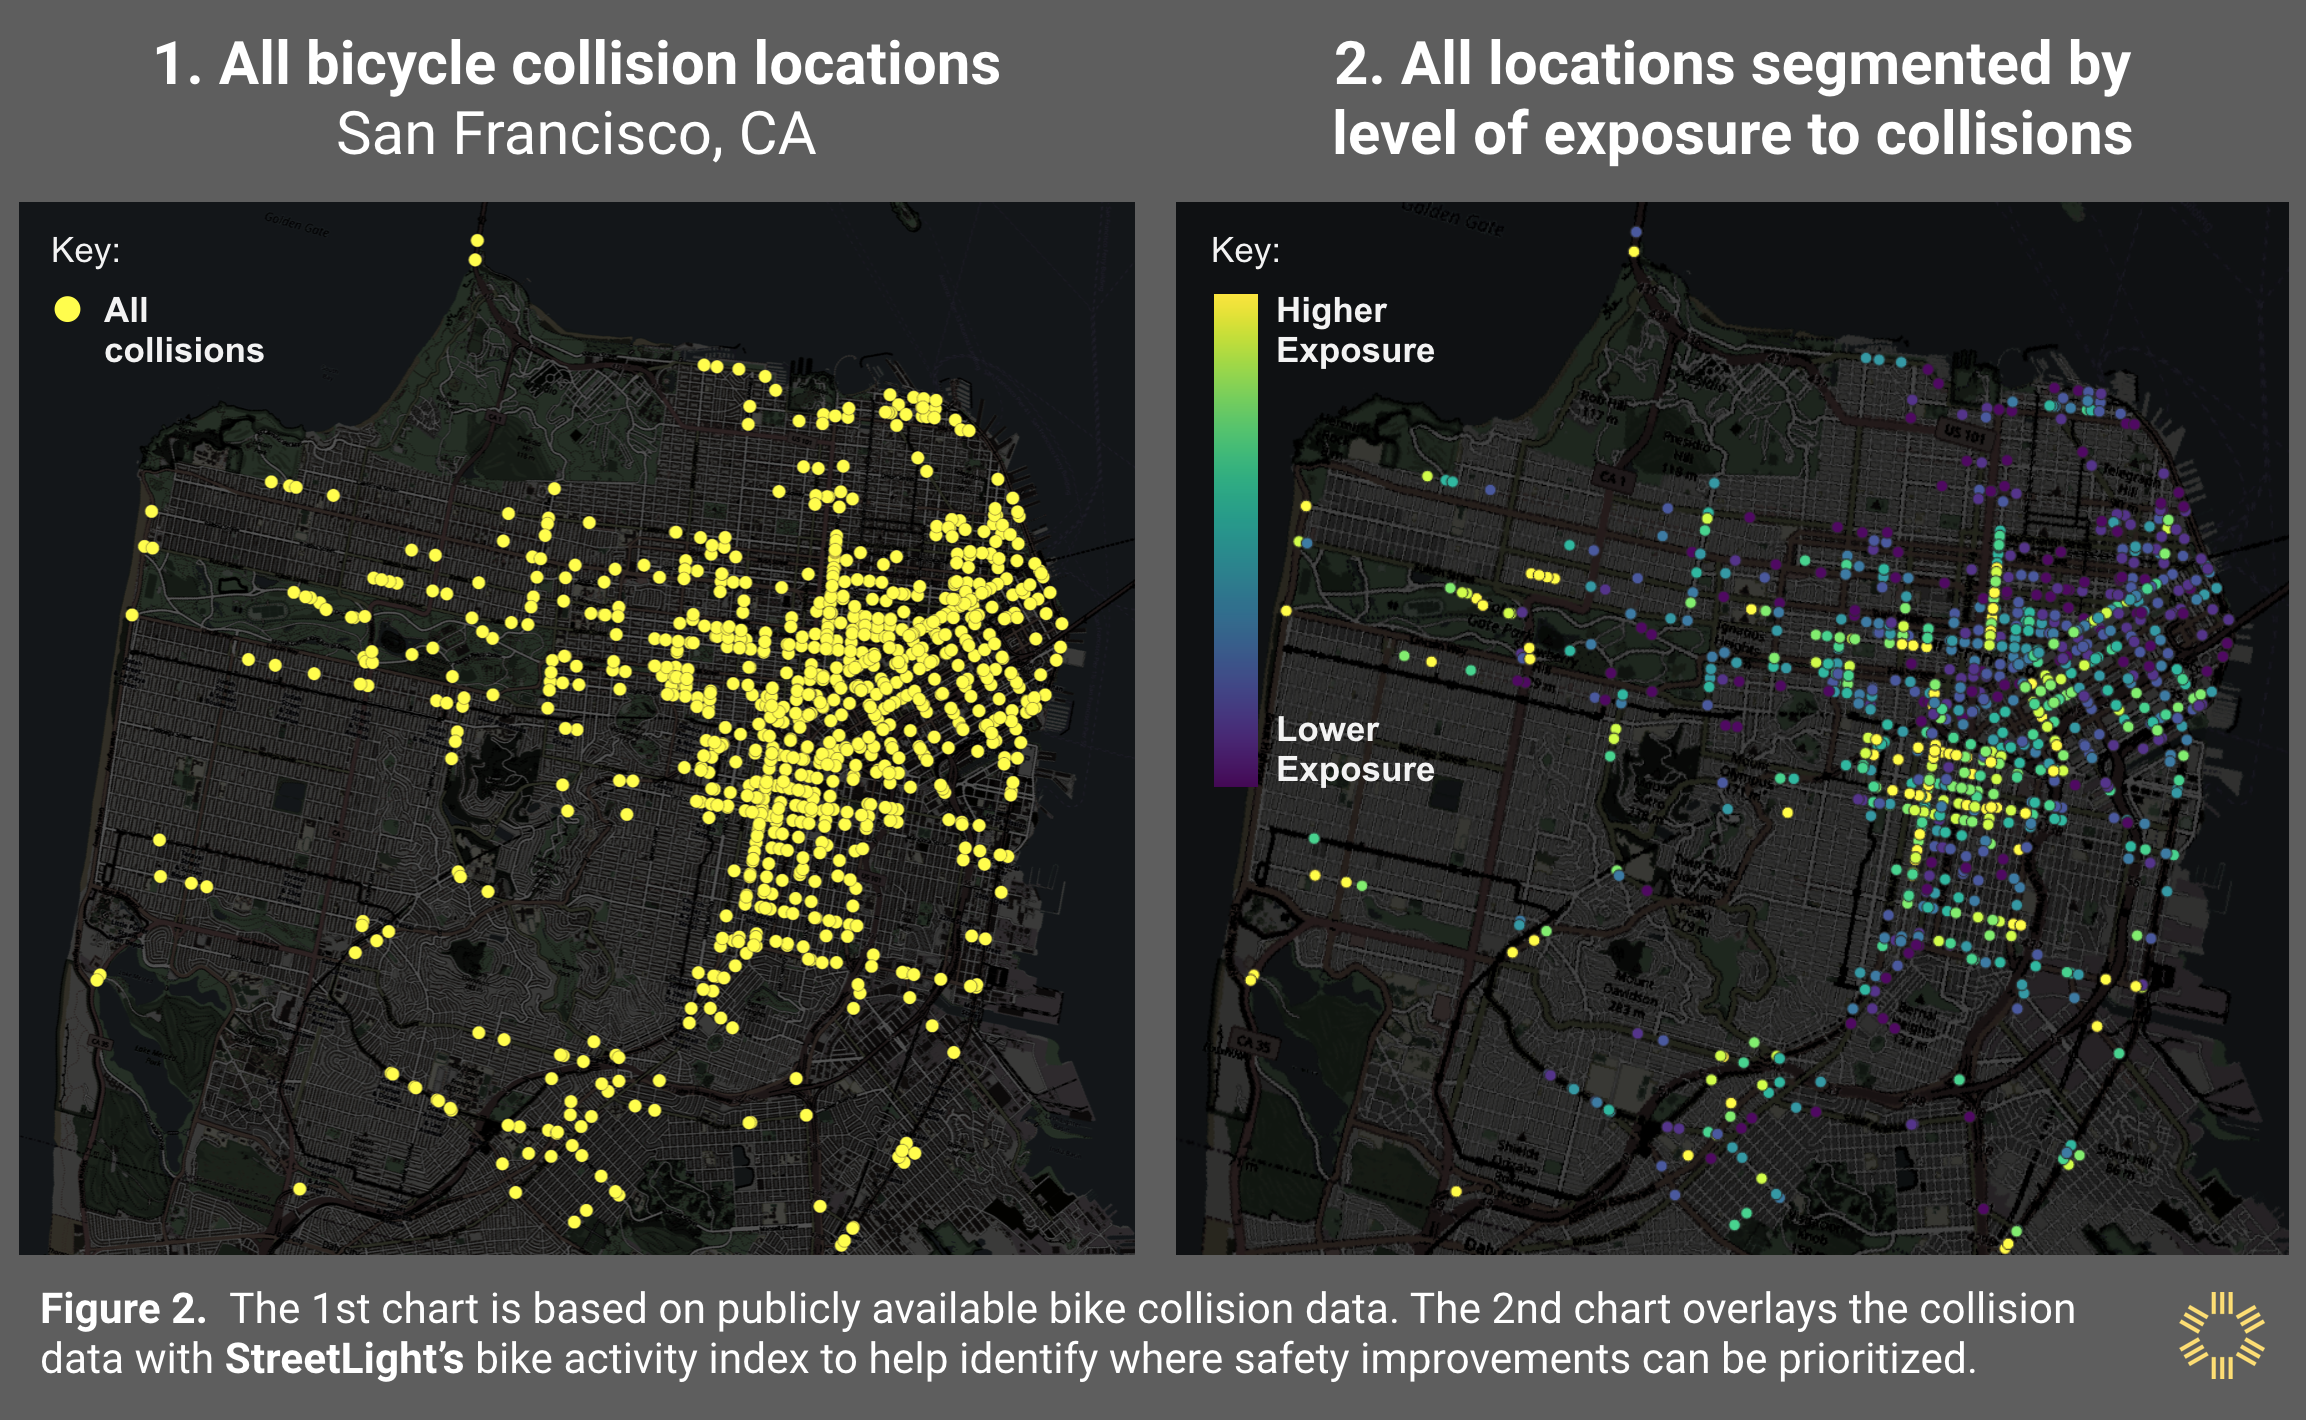
Without StreetLight Data’s bike activity metrics, cities have to rely largely on collision statistics to identify locations prone to bike collisions. Co continued, “Overlaying collision counts with our bicycle activity index across an entire city allows transportation agencies to pinpoint bike collision rates and quickly prioritize where to act first.” From 2015 to 2018, San Francisco saw over 1,400 bike injuries and fatal collisions. However, as StreetLight’s bike activity overlay reveals, transportation agency safety initiatives can be focused on a subset of roads with the highest exposure (where both bike traffic and collision rates are highest).
While addressing safety is a critical application, StreetLight Data’s Bike and Pedestrian Essentials tier provides metrics that are used by transportation professionals to solve a vast array of mobility challenges, including:
- Origin Destination: Trip volume between and within zones to identify demand
- Select Link: Route alternatives to measure success of current infrastructure
- Trip Attributes: Travel distance, time, speed to address first- and last-mile connections
- Traveler Attributes: Demographics and inferred trip purpose to ensure access to affordable options
For more information about StreetLight Data’s Bike and Pedestrian Essentials, please visit streetlightdata.com/bike-pedestrian-analytics/.