


COVID-19 had an unprecedented impact on transportation. Unemployment increased, as did working from home, along with ecommerce and restaurant delivery. Transit and airplane travel shrank, but more people rode bikes and walked outdoors. Some city dwellers fled to more spacious locations, and significant numbers of college students left campus and adopted remote learning.
The pandemic continues to wreak financial, medical, and social havoc on the world, but travel shutdowns in the U.S. gave us a peek at what might be possible: A healthy economy and population, but with less driving, and more bicycle and pedestrian travel.
For the 2020 U.S. Transportation Climate Impact Index, our data scientists analyzed six factors involved in transportation emissions. We ranked the 100 largest metro areas in the U.S. by how well (and how badly) they are managing those factors.
Our analysis uncovered three key takeaways from 2020.
Driving and Economic Growth Aren’t Connected
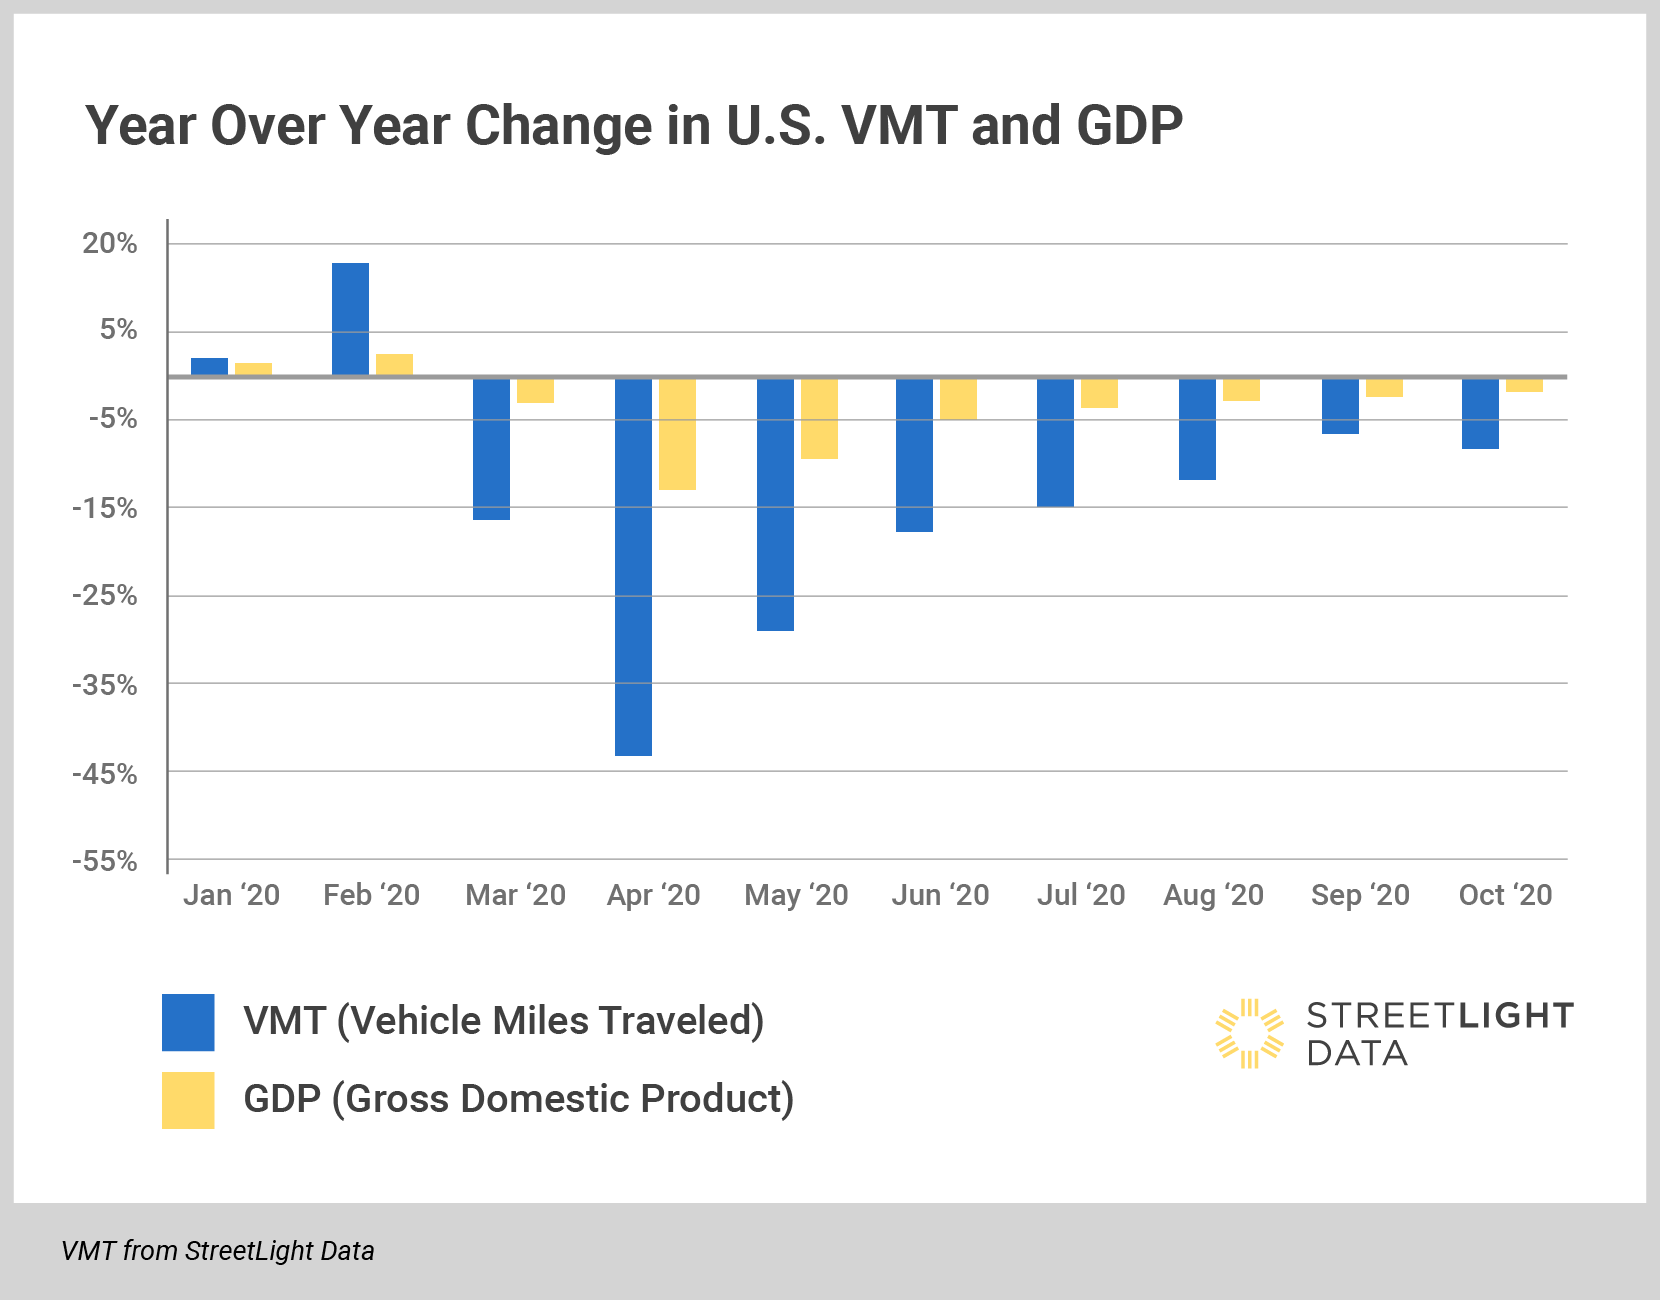
We saw 2020 VMT drop to unprecedented lows, but GDP didn’t follow suit, suggesting that decoupling VMT and GDP is possible. Encouragingly, the UN also noted that emissions have already peaked in GDP growth countries, indicating that VMT can drop while economic growth continues.
2020 VMT dropped to unprecedented lows, but GDP didn’t follow suit
“Many OECD economies have had a peak in greenhouse gas emissions, with efficiency improvements and growth in low-carbon energy sources more than offsetting the growth in economic activity,” notes the United Nations in the Emissions Gap Report 2020, again suggesting a decoupled future.
Active Transportation Plays a Larger Role
Many metro areas across the U.S. saw bicycles and pedestrians become more active in 2020. Although cycling activity increased in many areas, it actually dropped in many major cities – most notably in cities with a history of very active bike commuting. This isn’t surprising for a year with widespread work-from-home mandates.
See Inside StreetLight’s Bicycle and Pedestrian Metrics
Get access to data for analyzing bike and pedestrian trends for understanding the impact of COVID-19, and for planning future infrastructure and resource deployment.
Our analysis found that even in those cities, bicycling did not drop as much as driving. This indicates that bike riding took up a larger share of total miles traveled in 2020.
Four of our Top 10 made it to the list on the strength of relatively high bike travel, and three of those also have Top 10 pedestrian travel.
Work-From-Home Isn’t a Silver Bullet
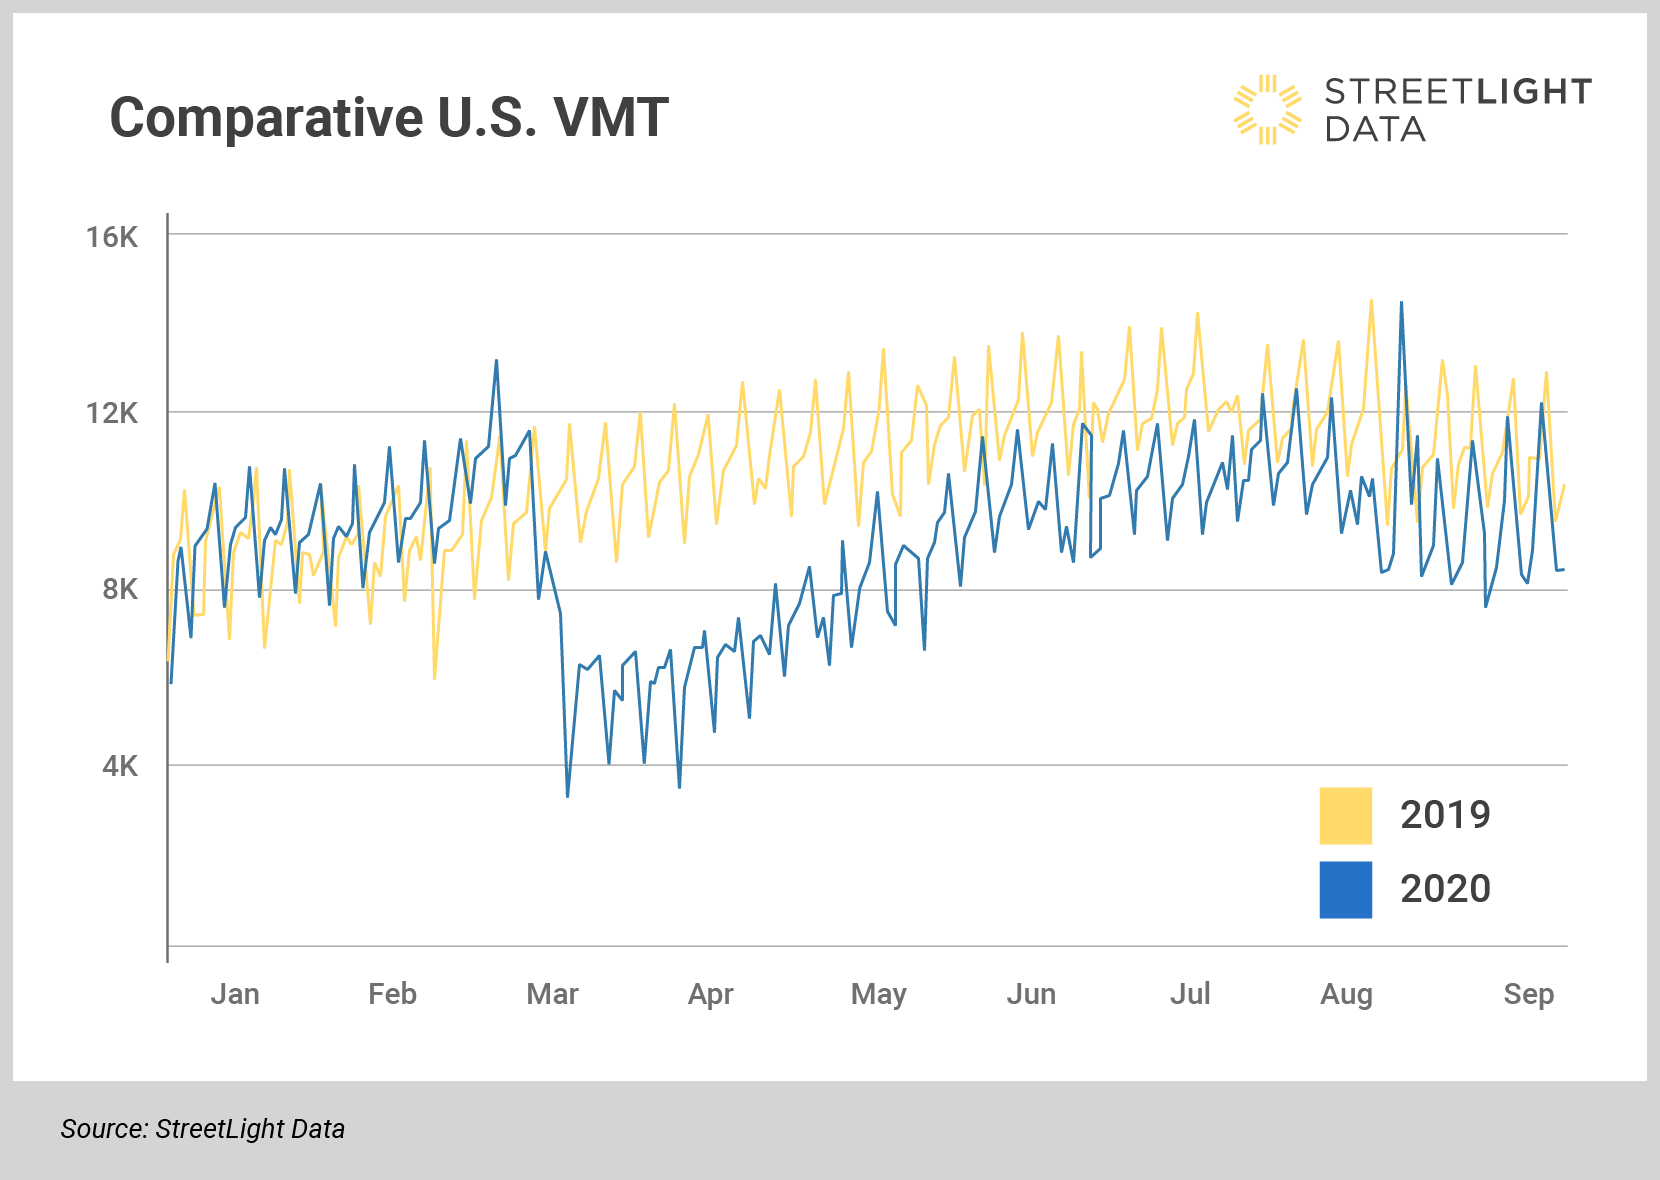
Although widespread work-from-home policies were still in place at the end of 2020, the fall in commuting did not translate to permanent or drastically lower amounts of driving. In fact, by August, VMT had begun to climb back to pre-pandemic levels, albeit with peak traffic spread over more hours during the day.
Work-from-home policies did not translate to permanently lower amounts of driving
Our analysis of hourly vehicle volume for major metros captured the reduction of peak AM rush hour. We saw similar travel patterns from Chicago, Los Angeles, Washington, D.C., and San Francisco: less driving from 6:00 to 9:00 am compared to 2019, with more comparative volume midday, building to a longer afternoon rush hour.
Where We See Potential for Change
Given the potential for decoupling economic growth from VMT, now is the time to create more financial and other incentives for reducing climate impact. If we don’t build that into our economic recovery, we risk obliterating any short-term gains made during COVID-19 travel shutdowns.
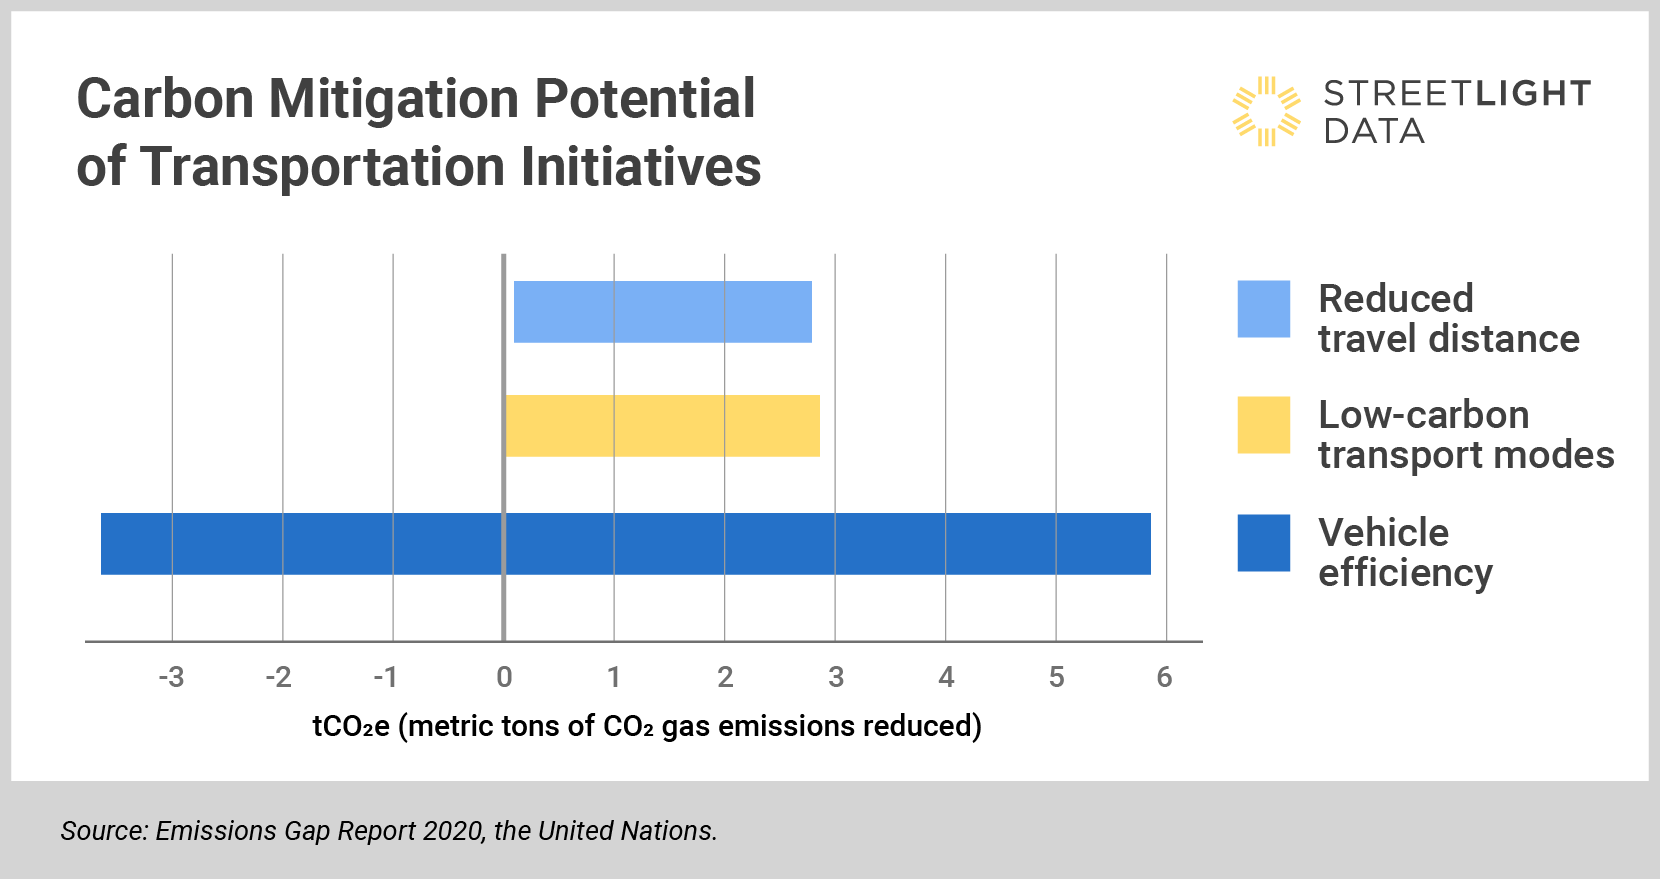
Transportation has the potential to move the needle. As noted in the Emissions Gap Report 2020, reduced travel distance and low-carbon travel modes could lower emissions by nearly six metric tons per year. Vehicle efficiency has the power to either increase emissions by three metric tons or decrease it by almost six metric tons annually.
One of the most encouraging 2020 takeaways: In 2020, many cities moved quickly to adjust transportation infrastructure to help citizens and businesses. This included closing streets to vehicles, opening sidewalks for restaurant seating, and adjusting parking options for delivery services. Cities should incorporate this “rapid planning” stance long-term, as transportation technology, behaviors, and economics will continue to evolve rapidly.
While working from home for white-collar workers didn’t eliminate huge amounts of VMT, it did open up the possibility of reduced commute driving. For example, if companies permanently adopt a one-day-a-week work-from-home policy (as StreetLight has for years), it could reduce their commute VMT by 20%.
In addition, while we don’t explicitly measure air travel in this report, the reduction in business travel was massive. Fewer conferences and meetings, or a few more virtual conferences instead of thousands of people flying to be together, can also lead to significant transportation emission reductions from white-collar business travel while, perhaps, improving productivity.
The bicycling boom could contribute to both lower emissions and economic recovery, argues a recent study from Portland State University[1]. The study of active transportation in six cities found that bike- and pedestrian-friendly street improvements had either positive impacts on the corridor’s economic and business performance (by boosting business and employment), or nonsignificant impacts.
The bicycling boom could contribute to both lower emissions and economic recovery
This year’s StreetLight Top 10 captures some pandemic-related shifts that affected transportation emissions, but not others (see the Methodology for more details). We look forward to seeing which of these cities can keep transportation emissions low while the economy recovers in 2021.
Learn How StreetLight’s Index Can Power Your Planning
The same data that powers our annual Index can support your own transportation analyses. Learn more about the vehicle, bicycle, pedestrian, and transit data behind real-world mobility initiatives across the country.
1. Understanding Economic and Business Impacts of Street Improvements for Bicycle and Pedestrian Mobility – A Multi-City Multi-Approach Exploration, National Institute for Transportation and Communities, 2019.
The StreetLight Top 10
1. New York-Newark-Jersey City, NY-NJ-PA
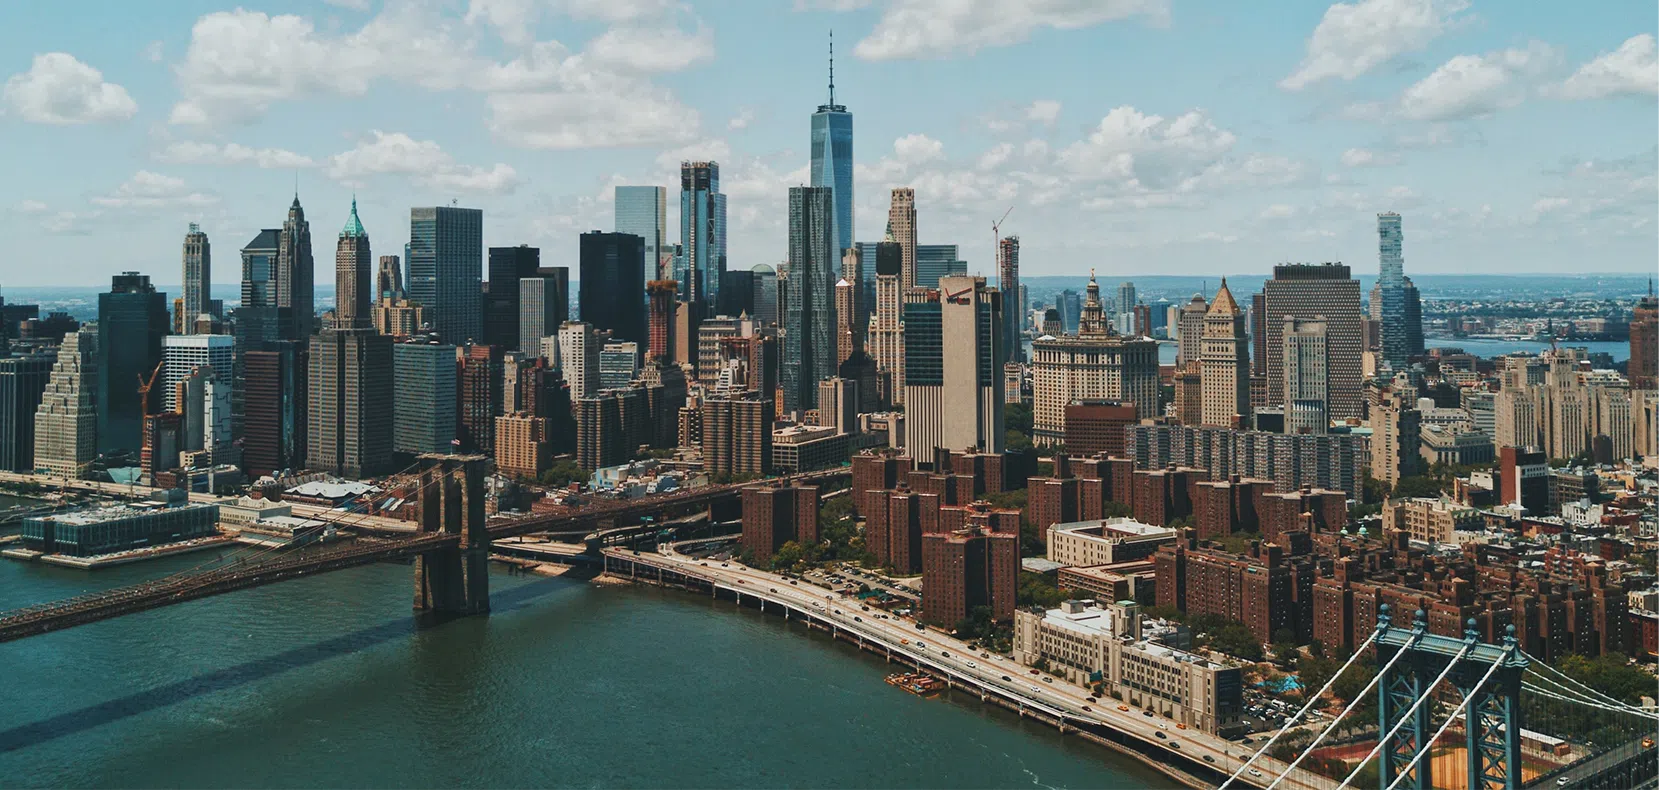

For a second year, the New York metro area tops our list, but for very different reasons. In 2019, New York ranked first or second in bike, pedestrian, and transit miles traveled. Those scores vaulted it into our top slot despite an abysmal VMT ranking of #80, compared to the other CBSAs.
In 2020, New York’s driving ground to a halt during the pandemic, placing it near the top of our VMT rankings. Transit activity per capita remained high, but bike and pedestrian activity slid farther down in our rankings, as compared to other cities in 2020.
Despite the fluctuations, New York remains an example of how cities can score well in our Index by adjusting a variety of factors, not just VMT. It’s important to note that New York City experienced significant population shifts during 2020, which may have elevated its scores (see our Methodology for more information).
2. North Port-Sarasota-Bradenton, FL
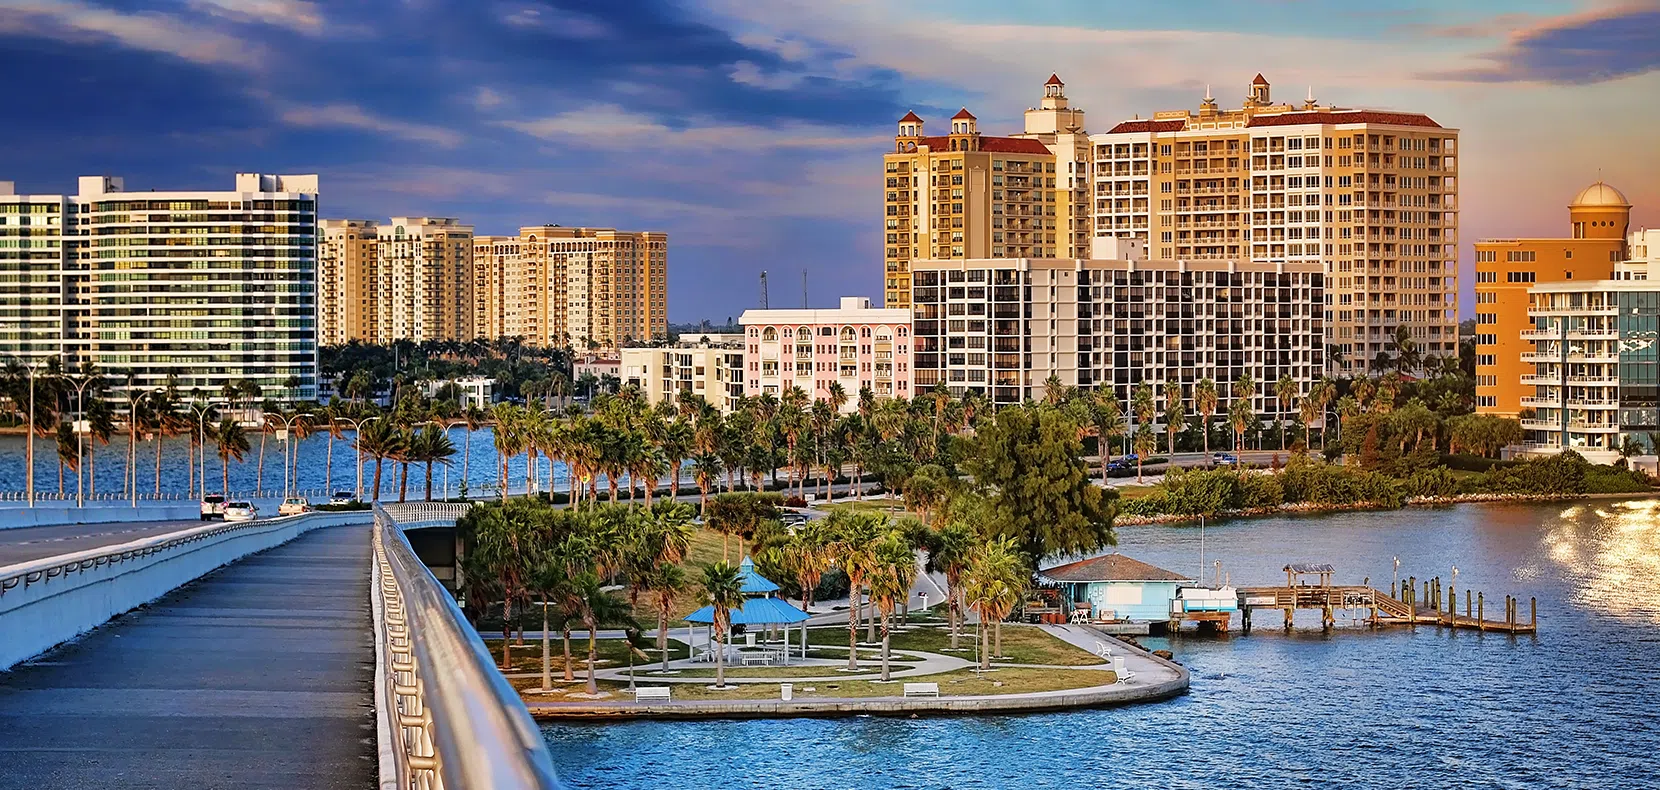

Florida has several cities on this year’s list, and Sarasota’s debut on the Top 10 illustrates how quickly a few tweaks can affect an area’s rank in our Index. Last year, Sarasota ranked #19 overall, with middle-of-the-road scores for all factors.
In 2020, Sarasota-area residents took advantage of the beautiful climate to engage in a lot of biking and walking. Sarasota tops our list for cycling activity, and places 4th for pedestrian travel. Those high scores combined with a top-third VMT rank boost Sarasota into second place on our overall list.
3. Portland-Vancouver-Hillsboro, OR-WA
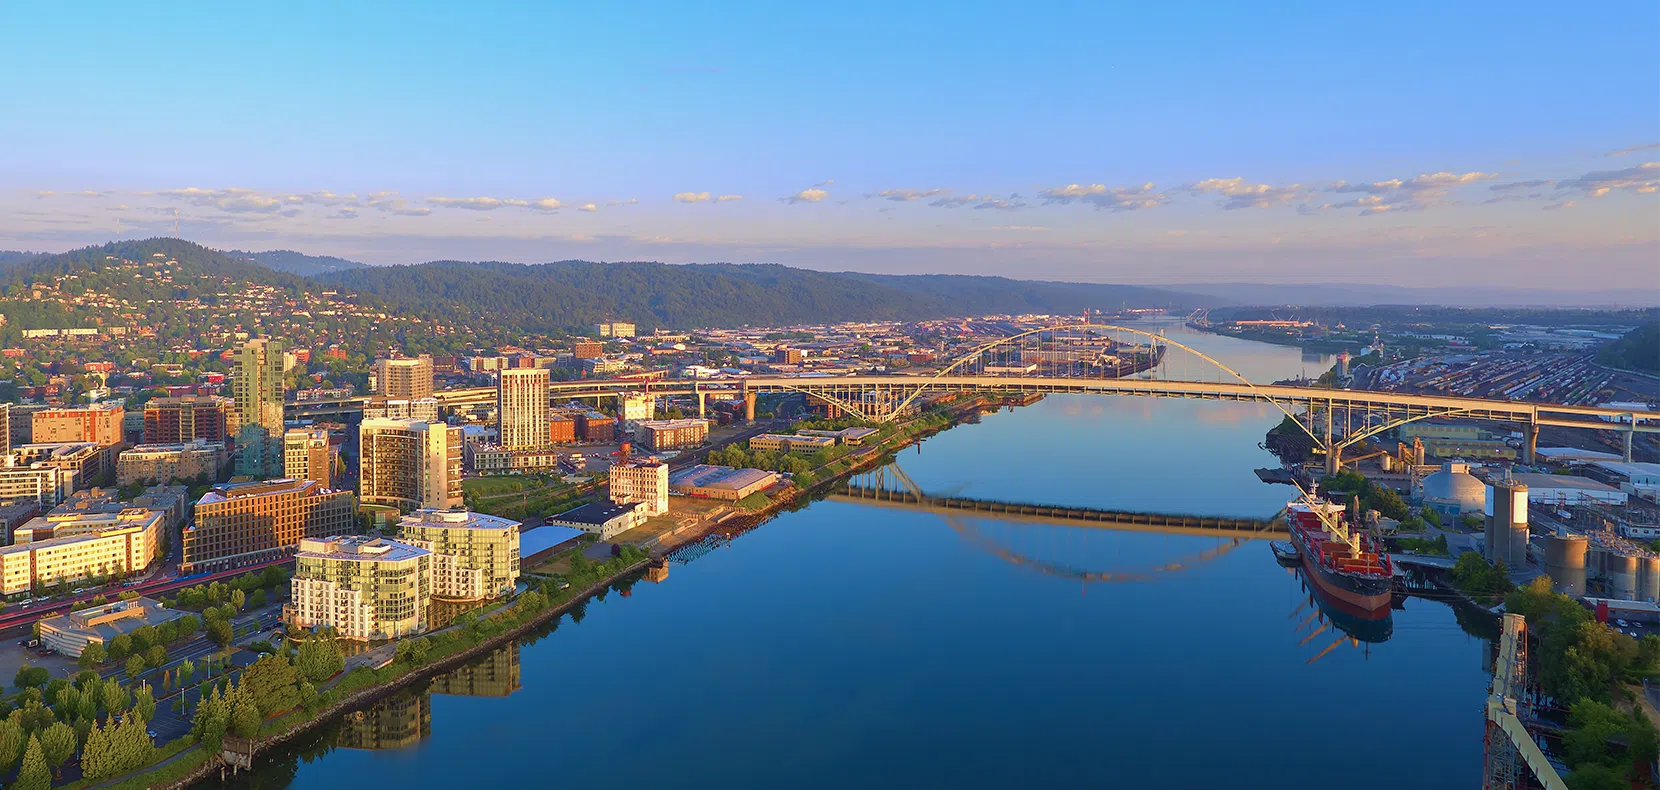

Last year Portland’s indexed VMT ranking was in the bottom quarter of the list but rose to #15 this year. At the same time, relative cycling activity in Portland rose a few rankings in 2020. The overall combination is enough to rate this city highly transportation climate-impact friendly.
4. Cape Coral-Ft Myers, FL
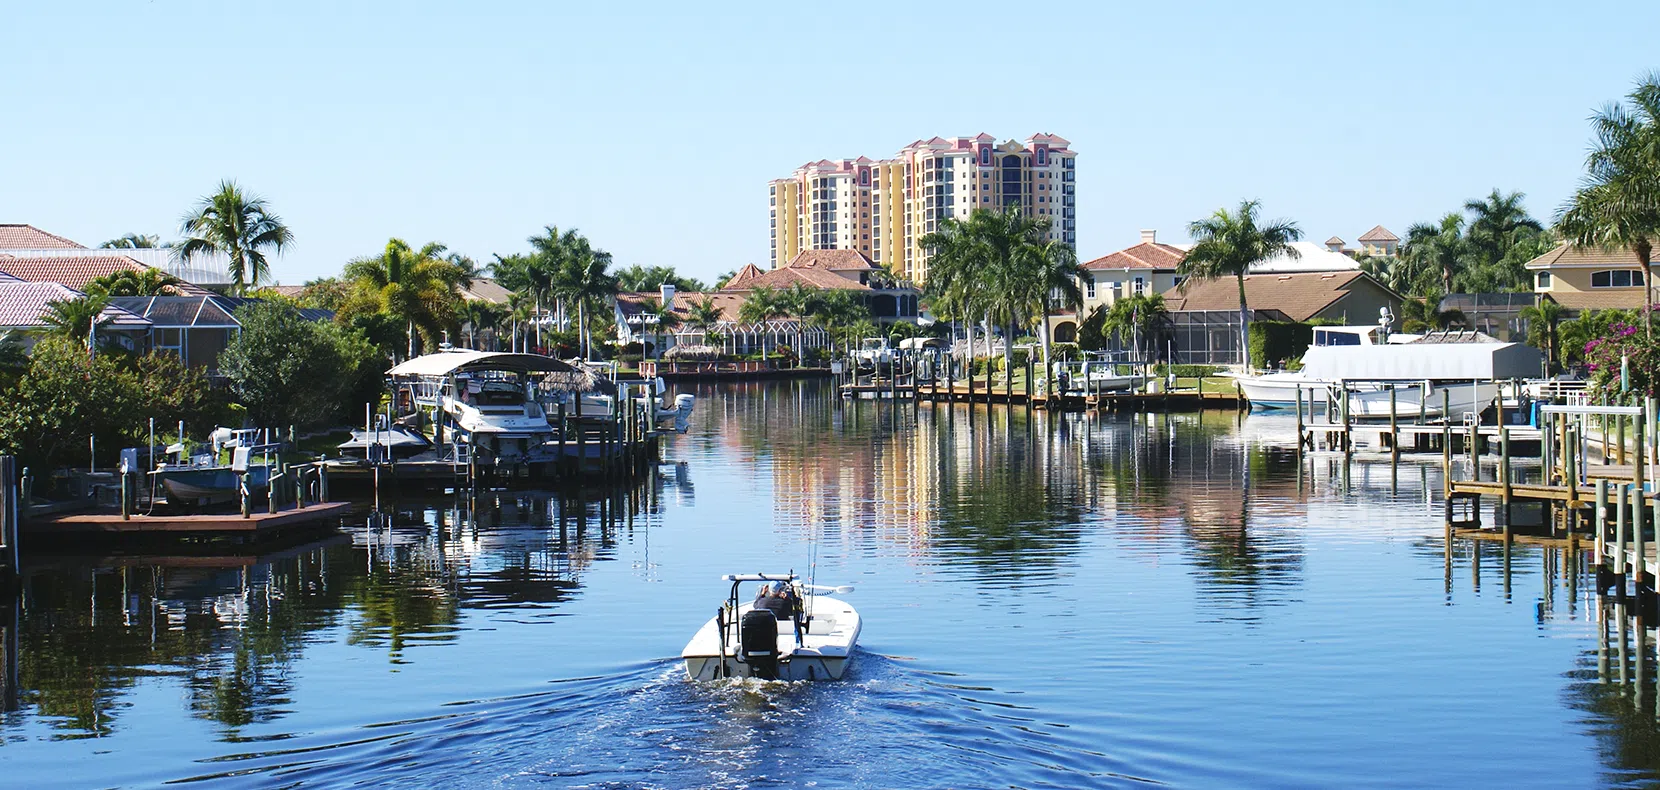

Cape Coral just missed making our Top 10 last year, but small adjustments in 2020 popped it up in the overall rankings. The city’s bicycle and pedestrian activity ranks higher this year compared to its peers. Ironically, VMT activity ranks slightly worse than in 2019, showing how our indexed transportation scores can be affected by a mix of initiatives rather than a single factor.
5. San Francisco-Oakland-Hayward, CA
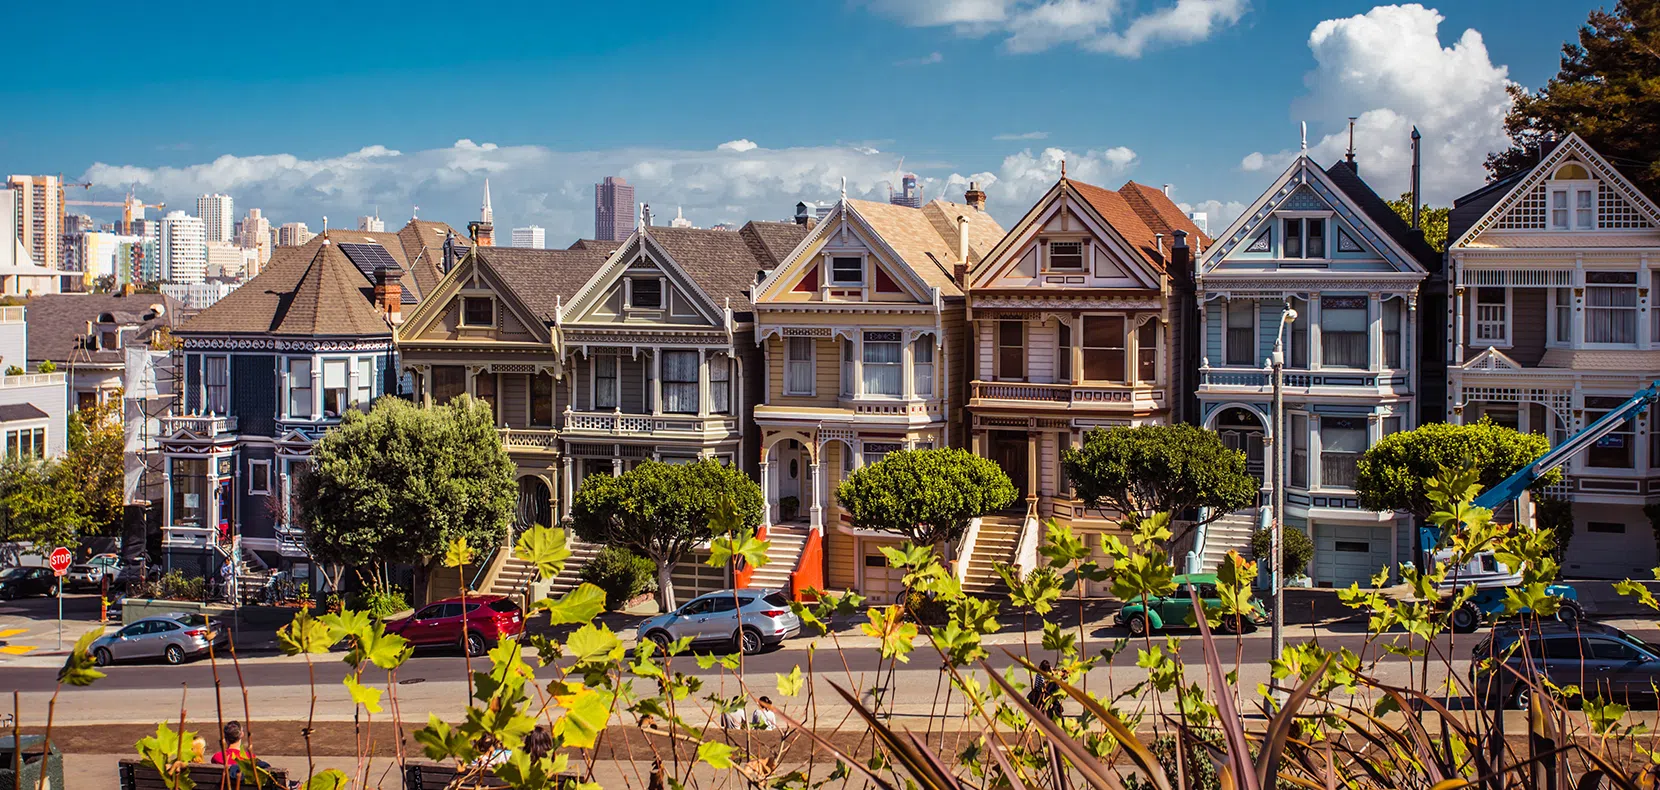

Last year’s number two city drops in our overall rankings, largely because other cities caught up on bike and pedestrian scores. As in New York, San Francisco’s VMT ranking improved markedly in 2020 because people stopped driving. But relative to other cities, Bay Area residents didn’t ride bikes or walk quite as much in 2020.
6. Miami-Fort Lauderdale-West Palm Beach, FL
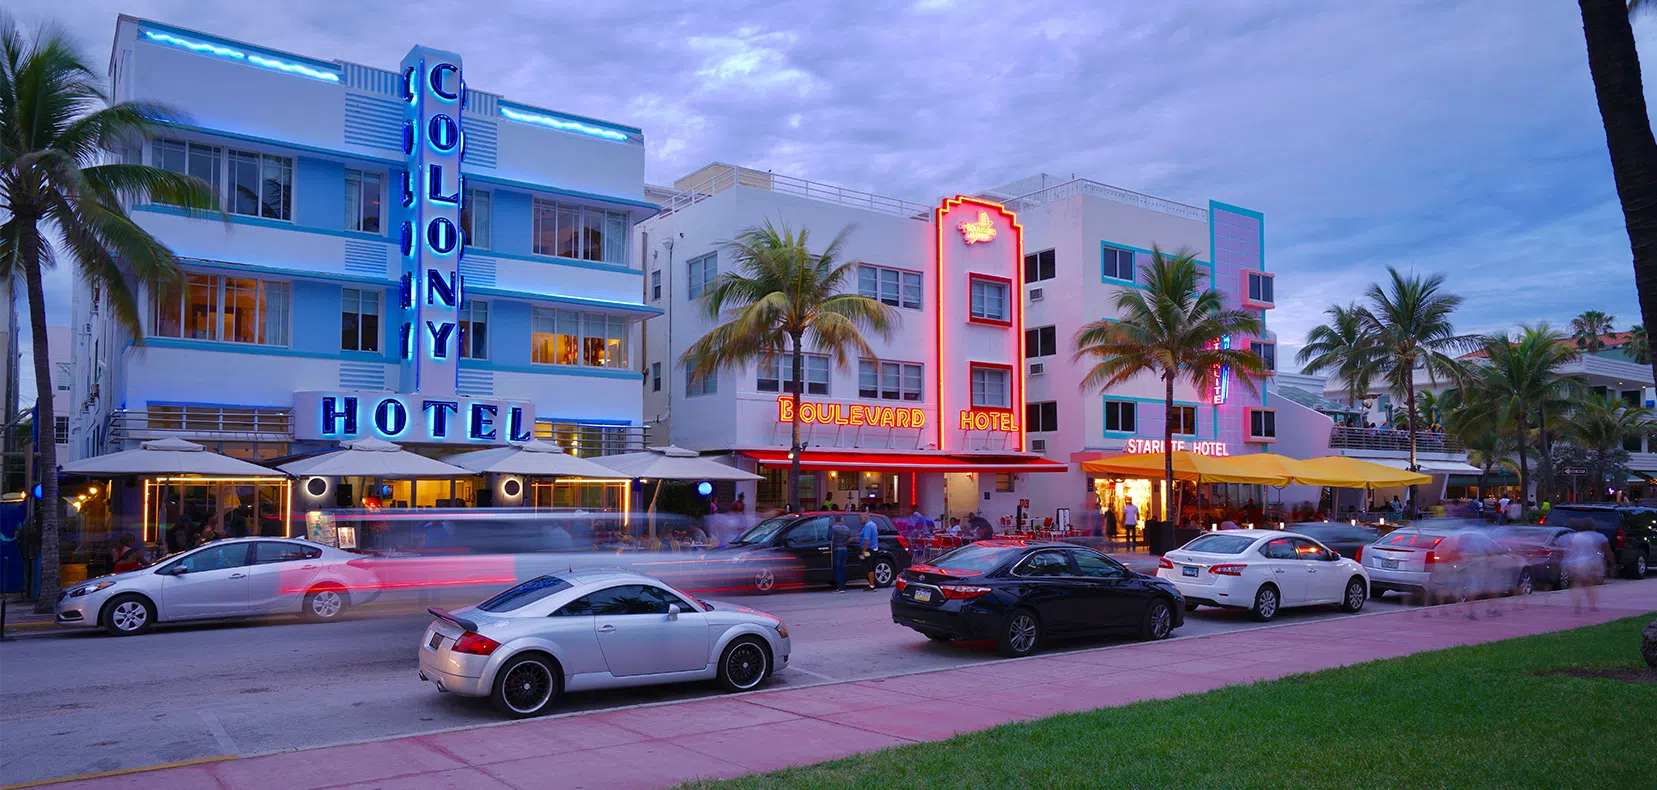

Miami made a remarkable jump compared to last year, largely on the strength of an impressive improvement in VMT ranking. In the worst 20 of last year’s VMT ranking, Miami places third-best this year, possibly related to a drop in tourism. Although the metro area’s bike and pedestrian rankings were worse this year compared to 2019, that giant drop in driving makes up for it.
7. Colorado Springs, CO
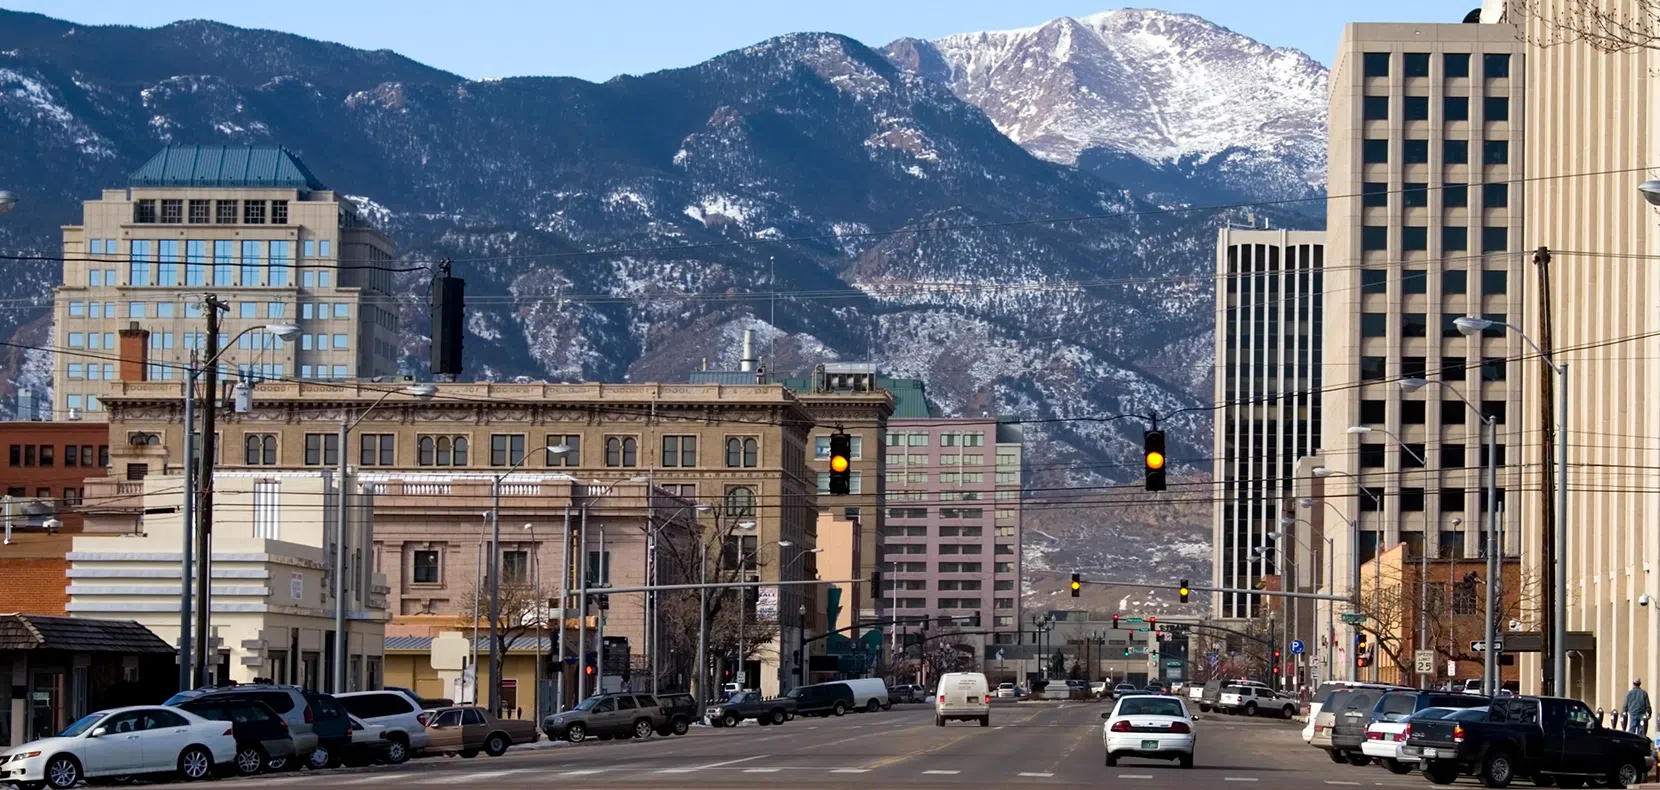

Last year, Colorado Springs was in or near the bottom half of our rankings for every single factor. But in 2020 it vaulted into the best 10 cities for both bike and pedestrian activity. Those scores and a slightly better VMT ranking helped this metro area move from an overall bottom third ranking to Top 10.
8. San Diego-Carlsbad, CA


San Diego made the largest jump of any city on our entire list. Last year, it was the fifth-worst metro area compared to its peers. This year, San Diego stands out with the second-lowest VMT/capita on our list. Not only did residents reduce driving in 2020, but they kept using public transportation, preserving San Diego’s already-healthy transit ranking.
9. Minneapolis-St. Paul-Bloomington, MN-WI


Another city where residents did an impressive job to reduce driving during the pandemic, the Minneapolis metro area rose from #95 for VMT/capita last year to #19 in 2020. The rest of its rankings remained almost unchanged from 2019, but Minneapolis stands out for dropping VMT/capita so markedly compared to its 2020 peers.
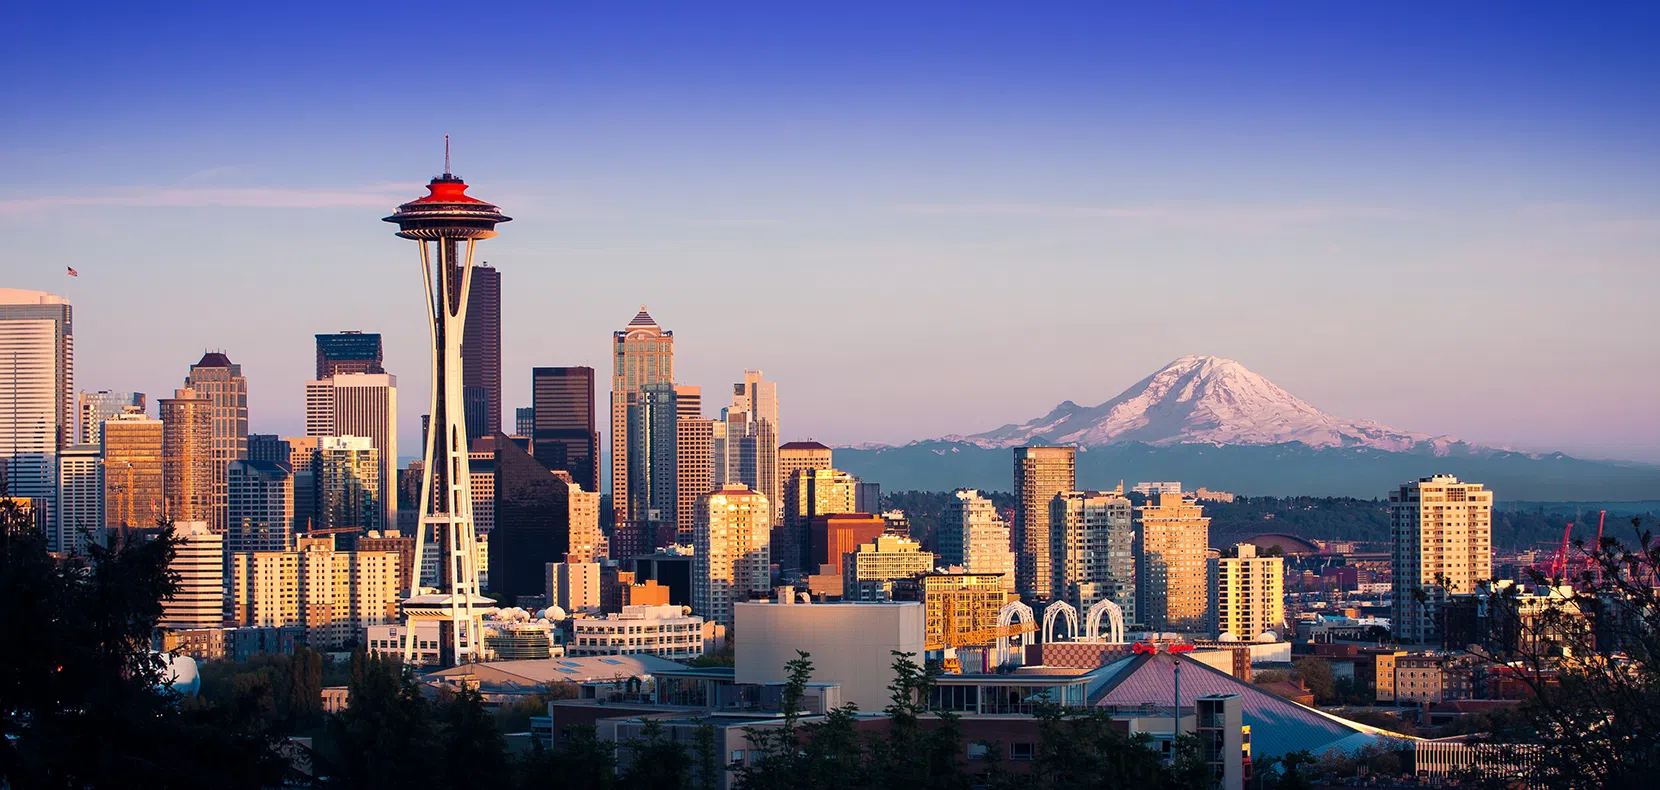
10. Seattle-Tacoma-Bellevue, WA

Seattle’s densely populated metro area with high transit use had the potential to place higher than #63 last year, but drivers relegated it to #85 on our VMT/capita ranking. This year, curtailed driving made a big difference, with Seattle jumping to #14 on VMT/capita ranking. Moderate bike and pedestrian scores helped Seattle break into the Top 10.