StreetLight Data is located in San Francisco CA, so many of our staff are voting next week on a Regional Ballot Initiative with considerable equity implications. It’s called Regional Measure 3. In short, it would increase tolls on all eight Bay Area bridges that are currently tolled. Thus, by the end of the six years, each toll will be $3 more expensive than it is now. This would raise an estimated $4.5B during the six years, all of which would go to fund a set of 35 highway and transit projects across the Bay Area. If you want more details, here’s an article from our local National Public Radio station, KQED: “10 Things to Know: Regional Measure 3, the Proposed Bay Area Bridge Toll Increase”.
I used StreetLight InSight® (that’s our on-demand transportation analytics platform) to get a better understanding of the equity implications of the toll increase. (Note: StreetLight Data does not currently endorse any political candidates or initiatives.)
Regional Measure 3 Ballot Initiative: Pros and Cons
The bill mirrors previous Regional Measures passed in 1988 and 2004. The bill enjoys very broad regional support, from agencies, newspaper editorial boards, legislators, and local groups. The presiding reason it enjoys support is because congestion is atrocious in the Bay, and many of our transit systems and networks are aging rapidly and unable to keep up with demand. As the population of the Bay Area continues to rise, the situation is becoming untenable. While some of the money will be spent on road improvements, about 2/3 of the money will be spent on transit projects,and many of the road dollars are for high occupancy vehicle (HOV) lanes. For example, $500M will go to BART upgrades and improvements, and $300M will to go ferry service expansion.
As for the cons, as KQED put it: “A handful of local legislators… oppose the measure. So do taxpayer groups such as the Howard Jarvis Taxpayers Association and taxpayers groups in Alameda, Contra Costa and Solano counties and in Silicon Valley. Republican Party county committees throughout the Bay Area also urge a “no” vote on the measure. A Marin County transportation advocacy group, the Transportation Defense and Education Fund (TransDEF), is also opposed. Among the chief reasons cited for opposing the measure: Higher bridge tolls amount to a regressive tax that will hit lower- and middle-income workers, who are already struggling with skyrocketing housing costs.”
For someone who drives to work five days a week across one of these bridges, and does or cannot take advantage of the new transit options funded by the measure, including the reduced-cost carpool bridge tolls, this will raise the cost of commuting by ~$750/year.
I want to note that all transportation policies that use cost as a lever are economically regressive – because transportation is a critical service, any increase that is not tagged to income will necessarily take a larger share of low-income travelers’ budgets. The question some Bay Area voters may be pondering this weekend is: “How disproportionate is the impact? If only we could know more about who is crossing each bridge…”
StreetLight InSight Analysis of Income of Bridge Travelers
I was one of those voters when I realized I have access to all the data I need. I set up a Project in StreetLight InSight to get an income breakdown for all of 2017 for travelers across the eight Bay Area bridges that will be affected by the toll increases. I included the Golden Gate Bridge too (although it is not included in the measure) because I was curious.
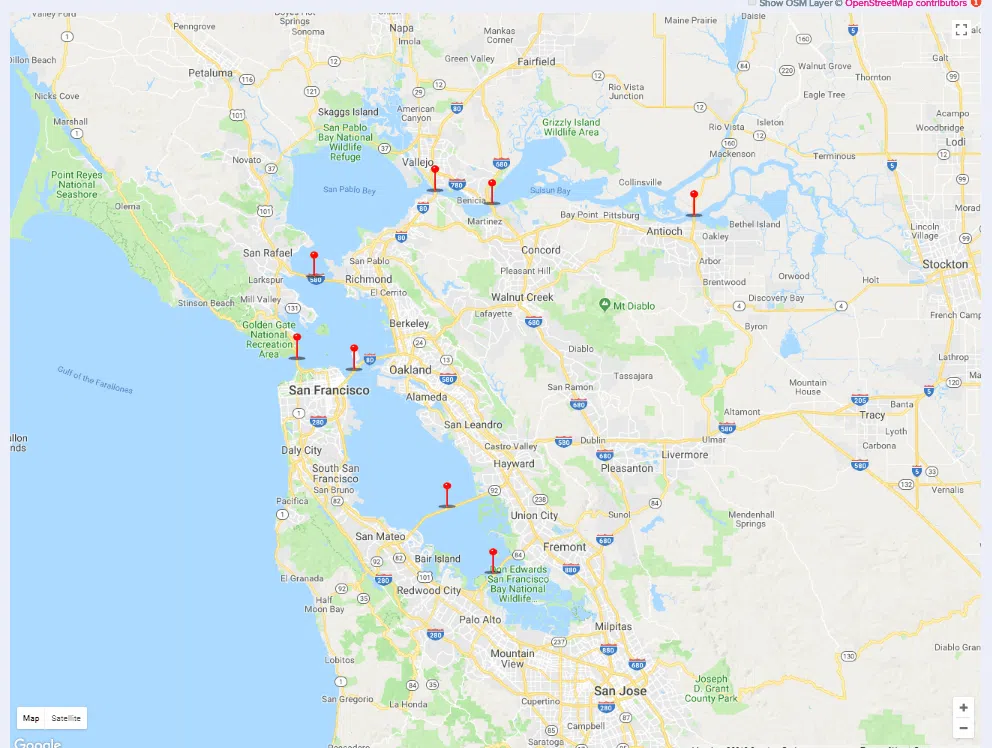
Map of the 9 bridges analyzed for this comparison.
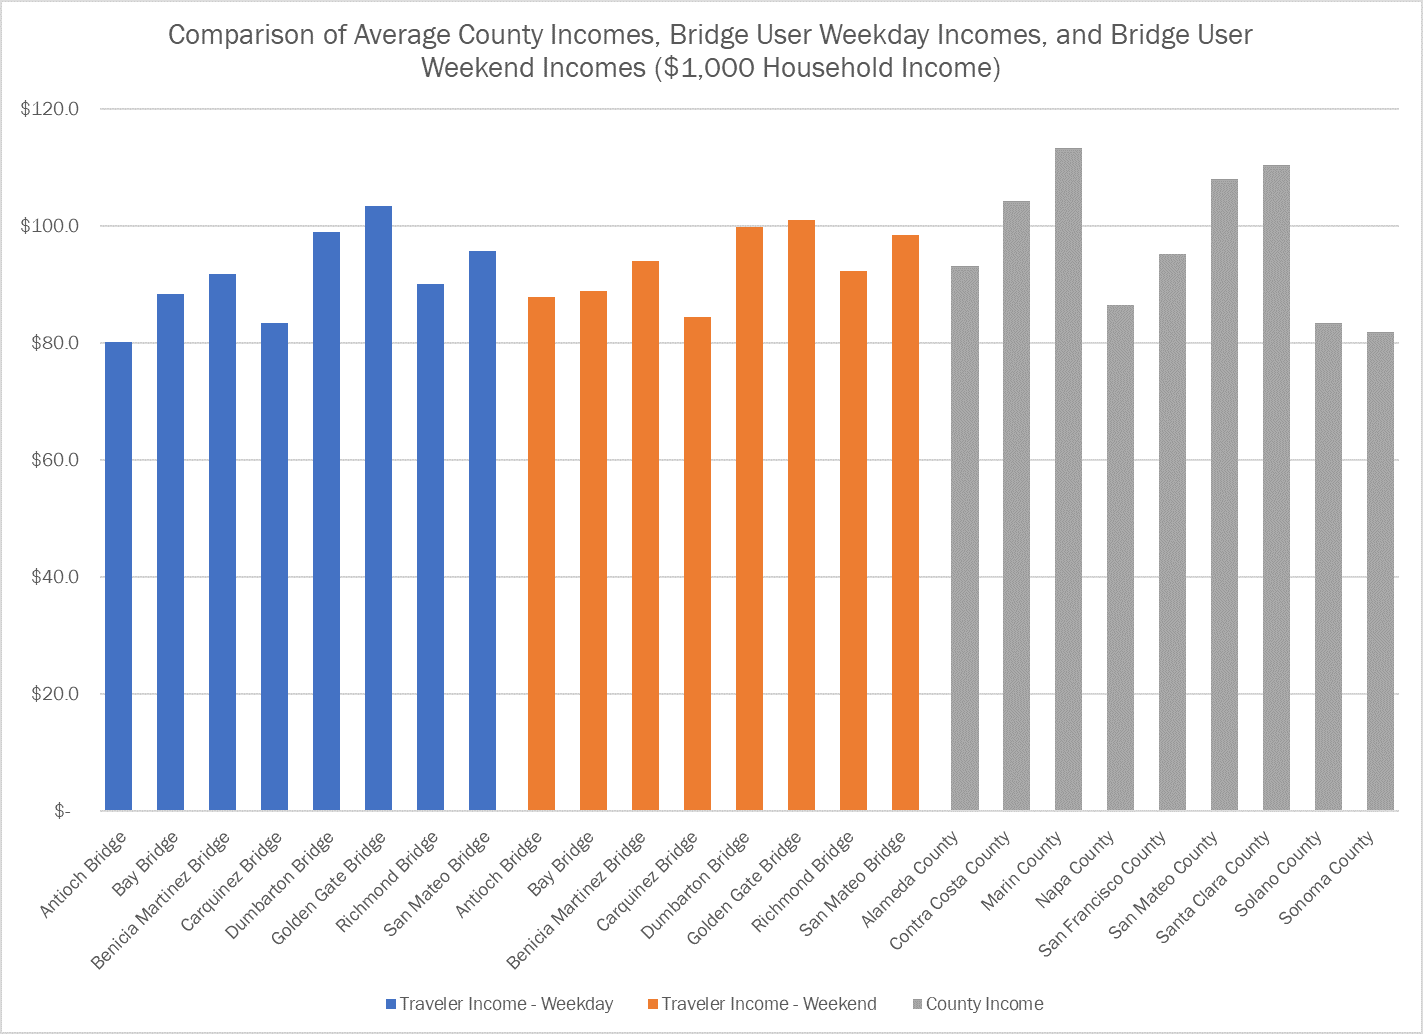
First, we compared the average income of bridge users during weekdays, weekends, and also compared that to average county incomes. The chart below shows the results. As you can see, there is a significant difference in the income of different bridge users. For example, users of the Dumbarton Bridge on average make over 20% more than users of the Carquinez Bridge. Weekends are much more equitable in terms of bridge income than weekdays.
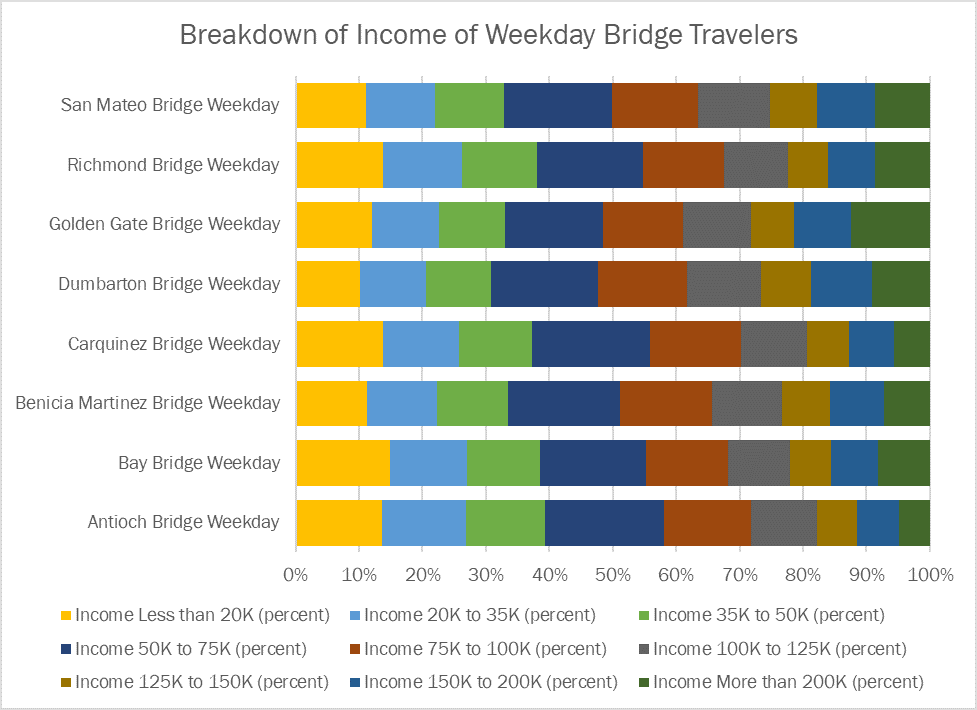
Because averages can sometimes be misleading, we also created charts showing the breakdown of income classes for bridge users, and the counties. All this just took a few clicks in StreetLight InSight.